Open Analytics Bounty: ETH (October 9)
Everything about compound lending and borrowing protocol
Introduction
==The popular Compound protocol== is one of the successful projects in the field of DeFi, created for decentralized lending and borrowing. Compound network and digital currency is supported by ==Coinbase== and Coinbase has been with this project since its inception and ==invested about $8M in it== from the beginning. Later, the Compand community created the ==COMP== token to manage this protocol, which is one of the famous ERC-20 tokens and was created on the Ethereum blockchain.
People who want to ==borrow== and people who want to ==lend== their money and earn interest on it, can use this DeFi platform. The interest rate of deposits and the interest rate of loans are determined based on the amount of supply and demand in the network. ==This platform supports 20 different assets for lending and borrowing process.== Those interested can visit This site to see these assets.
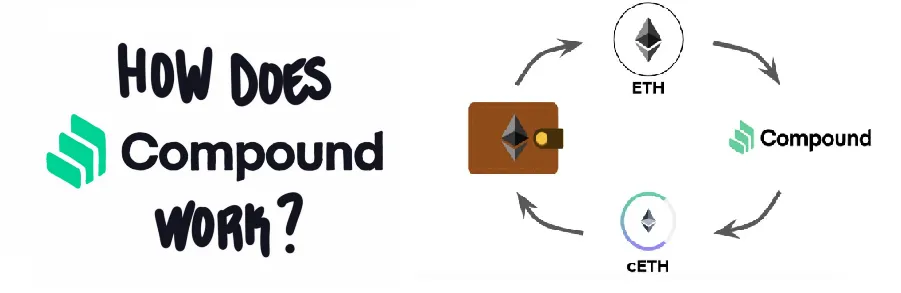
How does the compound protocol work?
The Compound protocol provides a money market that ==Borrow== the liquidity in this market to other people in the form of ==loans== and receives interest in return. This interest is divided among people based on the share of each liquidity provider. This interest rate is calculated algorithmically and according to the ==supply and demand== in this protocol, the interest rate is determined.
Borrow from Compound Protocol requires collateral. This ==collateral== is also transferred to the network in the form of digital currency and after that it is possible to withdraw the loan. The loan amount is determined according to the amount and type of collateral. The protocol uses the ==Collateral Factor== to determine the loan amount that the user can withdraw.
For example, you can refer to this address to see USDC Collateral Factor.
What is cToken?
In order to receive interest from the compound (lending), users must lock their assets in a smart contract; Instead, the smart contract generates new tokens called ==cTokens== at a predetermined exchange rate. These tokens allow the user to earn interest over time and use them as collateral to borrow from the platform.
When a user deposits digital currency into the platform, Ctokens represent the assets. Every time a user deposits their asset into the lending pool, the ==same amount of cToken is generated==. This Ctoken balance is a direct representative and ==equivalent== to the amount of assets that the user has in the lending pool and receives interest from each Ethereum block.
Sources:
dashboard Purpose
The purpose of creating this dashboard is to examine the ==lending== and ==borrowing== process of the Compound protocol. Our intention is to explore the ==amount of supply== ==and borrowing==, the ==number of suppliers and borrowers==, as well as the ==number of supplies and loans taken== in the Compound protocol over time.
In this dashboard, we will also review the ==supplied== and ==borrowed== ==tokens==, distribute the ==volume== of loans and their ==number==, and identify the ==top== borrowers and lenders.
In this dashboard, we will review the amount of supply and borrowing against ==repayment== and ==redemption== of loans on a ==monthly== basis,we will also explore ==new users== in the process of lending and borrowing, and make visualizations about the ==annual comparison== of the amount of borrowing and supply,
And we will provide visualizations about the ==growth== of the amount of borrowing and supply and unique suppliers and borrowers, as well as the number of supplies and borrowings.
At the end of this dashboard, we will discuss the ==current situation== of the compound protocol market and provide ==statistics== in the fields of lending and borrowing.
Methodology
We have divided this dashboard into ==4 sections==, which are,
the first section: ==borrowing==
the second section: ==supply==
the third section: ==contrast==
the fourth section: ==current market stats==
We used the ethereum.compound.ez_borrows table to present the visualizations of the first part, and the ethereum.compound.ez_deposits table was used to present the visualizations of the second part, and the ethereum.compound.ez_redemptions and ethereum.compound.ez_repayments tables were used to present the visualizations of the third part. We used the ethereum.compound.ez_market_stats table for charts of the fourth section.
Part I - Borrowing
In this section, we will present visualizations about compound protocol borrowing. Visualizations about the amount and number of loans, as well as the number of unique borrowers on a monthly basis. We will also review the tokens of the borrowing process on a monthly basis. Also, we will review the various items that are necessary to present in this section.
The statistics and information seen in this dashboard are related to October 14, 2022, and this dashboard will be updated daily.
observations
The year 2021 has been a very good year for Compound Protocol in terms of the amount of borrowing. In this year, the largest amount of loans received by borrowers has reached nearly $10B in May 2021. It seems that even some of the largest traditional banks in the world have the ability They don't have to pay this amount as a loan within a month, and this shows the users' trust in a decentralized protocol, as well as the management power and order of a protocol.
The total amount of loans received in 2021 has reached more than $70B and this is a very impressive number.
June 2020 had the highest number of unique borrowers and the highest number of borrows over time in the Compound protocol. 4,000 unique borrowers have borrowed more than 13,500 times this month.
The years 2020 and 2021 have had a very close competition in terms of the number of borrowers and the number of loans, and in total, each has won in one field. In 2020, we see the largest number of loans received by users, during this year, users have borrowed about 82,000 times from the Compound protocol. This number of borrowing has been done by about 52,000 unique users,and during this borrowing process in 2020, more than $14B of loans have been received by borrowers.
But 2021 ranks first in terms of the number of borrowers with a difference of 4000 users compared to 2020. During this year, more than 56,000 unique borrowers have borrowed more than $70B during about 80,000 borrowing times.
Although the number of loans received in 2020 is more than that of 2021 and the number of borrowers is 4000 different from 2021, the total amount of loans received and the average daily amount of loans received in 2020 is less than that of 2021. In 2021, it is about 3 times that of 2020, and in my opinion, this shows the progress of the project compared to the previous year, as well as the trust of the users in the project, which has increased with the passage of time and the riskiness of the project has increased.
It can be said that after August 2021, we see a downward trend in the amount of borrowing, although we see a jump in October 2021, but the downward trend in the amount of borrowing has been continuous, and as we can see, from about $4B in August 2021 to about $900M in September This year has arrived.
It seems that after May 2021, the trend of the number of loans and the number of borrowers has changed to a downward trend, and we see a decrease in the number of loans and the number of borrowers, as we can see that the number of borrowers has increased from about 3000 to about 700 users in September 2022, and the number of loans Received from about 10,000 to about 2,000 times.
It seems that borrowers are more willing to receive stablecoins as loans, and among them, 2 stablecoins, DAI and USDC, account for the largest amount of received loans.
As we can see, in May 2021, when the largest amount of loans was received by borrowers, 2 stablecoins DAI and USDC had a larger share in the amount of loans, about $4B DAI and more than $3.5B USDC.
We can see that the situation is the same in terms of the number of borrowers and the number of loans, and in July 2020, the largest number of borrowers is related to DAI Stablecoin , where more than 2000 unique borrowers have borrowed this token, of course, in the meantime, USDT Stablecoin also has something to say. And in June 2020, this token was borrowed about 3900 times, which was more than DAI and USDC.
observations
As it was said and it can also be seen in the charts of Top Token, users are more willing to borrow stablecoins, and we can see that the 3 stablecoins, Dai, USDC, and USDT are the most in terms of the amount and number of loans and the number of users.
Ethereum is in the fourth place, and the WBTC and BAT tokens are in the fifth and sixth place and are competing with each other in different ways.
Regarding the top 10 borrowers, it can be seen that the first Address has borrowed an impressive amount of $2.95B, and the interesting thing is that this address is not in the list of the top 10 addresses that have received the most loans. And another interesting point is that the address that borrowed more than 7000 times is not in the list of top 10 borrowers in terms of loan amount.
observations
According to the loan amount distribution chart, it should be said that users who have received loans between $1000 and $100K from Compound protocol are more than other users, as we can see that more than 65,000 unique users have received loans between $1000 and $100K.
According to the loan holding time chart, it should be said that more than half of the borrowers have Held the received loans between 1 and 10 days.
The distribution chart of received loans count shows that about 12,000 unique users have borrowed at least 1 time from the Compound protocol, and users who have borrowed 5 times from this protocol are more than 1,000 unique users.
According to the annual comparison chart of the amount of borrowing, we can see that in the 3 items specified in the chart, the year 2021 is superior to other years, as we can see that the maximum amount of borrowing in 2021 was about $490K and the average amount of borrowing was about $900K and the median amount Annual borrowing is about $20K .
Another noteworthy point is that the maximum amount of borrowing in 2022 is more than 2020 and since the data of 2020 and 2022 are not the same in terms of the number of months, it is not possible to give a correct opinion about the average and median, but it must be said that these two items in the year 2022 are more than 2020 considering that we have data for 7 months of 2020 and 8.5 months of 2022.
The minimum item is shown as zero due to the decimal nature of the loan amount.
As we can see, the growth charts also show the growth rate of the amount of borrowing and the number of borrowers and the number of loans We can see that the borrowing amount has increased from $23M to $95B and the number of unique borrowers has increased from 3 users to more than 130K users and the number of loans has increased from 518 to about 200K.
observations
In 2021, the largest amount of supply has been done in the Compound protocol. In this year, more than $235B have been deposited in this protocol, although the number of unique depositors and the number of deposit transactions have been less since 2020.
In 2021, more than 80K unique users have deposited more than $235B in the Compound protocol during more than 190K deposit transactions.
In 2020, the most suppliers have deposited in the compound protocol during the most deposit transactions, as we can see, this year more than 300K unique depositors have deposited more than 500K times in this protocol, but it can be said that the deposit per The unique user has been less than in 2021, and I think this is the increase of trust and risk-taking towards a DeFi protocol over time.
We can see that the most deposits were made in the last month of 2021, and surprisingly, after entering 2022, this deposit suddenly decreased from $40B to $4B, and it seems that this is due to the market conditions and the supply of investable tokens. Their price reduction in 2022 depends.
We see the largest number of investors in November 2020, and the number of depositors has started to decrease since the same month, but as we have seen, in 2021, the amount of deposits per user has increased significantly.
We also see the highest number of investments in November 2020, and the number of deposits has started to decline since the same month, from more than 173,000 to about 5,000 times in September this year.
It seems that in terms of deposits, users are more inclined to deposit Ethereum, as we can see in December 2021, when the most deposits were made, the amount of Ethereum deposits is more than the USDC token, and in November 2020, in terms of the number of deposits Ethereum ranks second after USDC and has been deposited more than 35,000 times and more than 28,000 users have deposited this token.
observations
As it was said and the charts of Top Token also show that in terms of the amount of deposits, the Ethereum token has taken the place of the Dai token and has been the most invested, as we can see over time, more than $122B of Ethereum tokens has been deposited in the compound protocol.
In terms of the number of depositors, it should be said that more depositors have deposited the USDC token, and in this sense, the Ethereum token is in second place.
In terms of the top depositors, it should be said that the top user has deposited about $40B in the compound protocol and it does not seem that this is a personal address and wallet, and like the borrowing process, none of the top 10 addresses in terms of the number of deposits and the amount of the deposit are not the same.
In my opinion, depositing more than 16,000 times cannot be done by one person, and it is most likely that this work comes from a collection or Bot.
observations
The distribution chart of the amount of deposit shows that most of the users have invested between $1 and $10 and more than 100K users have deposited between $100 and $10K.
The chart of the deposit period shows that about half of the depositors make deposits between 10 and 10 days.
The distribution chart of the number of deposits shows that more than 280k users have deposited at least 1 time in the compound protocol.
The annual comparison chart shows that the maximum, average, and median amount of deposits was higher in 2021. During this year, the maximum deposit amount is more than $1.3B, and the annual average deposit amount is $1.2M, just like the borrowing process, and with the same stated conditions, the maximum, average and median amount in 2022 is higher than 2020.
And at the end of this section, the growth charts tell us how the amount of supply in the compound protocol has increased from $76M to $289B, the number of unique depositors has increased from 3000 users to more than 400K users, and the number of supply transactions has increased from 2500 transactions to 900K supply transactions.
Part II - Supply
In this section, we will provide visualizations related to the amount of supply, the number of unique depositors, and the number of deposit transactions, and we will review the necessary items in this section, including visualizations of the top 10 and top tokens, distribution charts, and comparison charts.
Part III - contrast
In this small but important section, we intend to deal with the contrast between borrowers and repayers and the contrast between depositors and redeemers and show the net amount of reserve and interest on a monthly basis. At the end of this section, we will compare new borrowers and depositors.
observations
The contrast charts show that in the monthly deposit process, the highest amount of reservation was in July 2021, during this month, deposited about $17B and withdrawn about $11.5B, and the net monthly reserve in this month is more than $5B.
In the monthly deposit process, the largest amount of deposit and withdrawal was in December 2021, during which the compound protocol reached $3B negative reserve.
According to the graph of borrowing and repayment, the highest negative interest for the compound protocol was in July 2021, during which it experienced a negative interest of about $4B.
The largest amount of borrowing and repayment was in May 2021, during which the compound protocol reached more than $2B positive interest.
And at the end of this section, the graphs of new users tell us that over time, Compound Protocol has had more than 380,000 new depositors and more than 28,000 new borrowers, with the largest number of new depositors in November 2020 and the largest number of new borrowers in June 2020.
In the monthly graph of new users in the supply process, it can be said that since November 2020 we have seen a downward trend in this graph and new users in the compound protocol are decreasing. As we can see, the number of new users in the depositing section of the compound protocol has increased from more than 128k to about 800 new users in September.
In the borrowing process, the downward trend in the number of new users has started since June 2020 and has reached 320 new borrowers from around 3500 in September.
But in general, the addition of more than 400K new users in about 3 years is impressive.
conclusion
In this dashboard, we tried to present all the statistics and information related to compound lending and borrowing protocol We expressed our observations about the total amount of loans and lends, the total number of users for each process, and the number of transactions related to each process. We have seen that the amount of supply is much higher than the amount of borrowing in this project, but this protocol with its floating APY system, which is based on the supply and demand of tokens, has been able to attract many fans and investors.
Investing about $290B in a decentralized protocol is very impressive and I don't think many traditional banks can do this. It seems that this protocol has been able to show its growth and attractiveness with proper and regular management as well as relying on its community using Comp Token . In my opinion, if the market situation would not be like this in 2022 and the supply and demand of tokens supported by this protocol would grow strongly, this protocol could be the strongest lending and borrowing protocol in the entire cryptocurrency market.