City Amidst the Storm
Provide a thoughtful analysis of how NEAR is weathering the market turbulence that occurred as a result of FTX’ insolvency.
Solana is a Blockchain Platform Designed to Host Decentralized, Scalable Applications
- Solana is a blockchain platform designed to host decentralized, scalable applications.
- Solana can process many more transactions per second and charges lower transaction fees than rival blockchains like Ethereum.
- Solana is a proof-of-stake (PoS) blockchain but improves on it with a mechanism called proof-of-history (PoH), which uses hashed timestamps to verify when transactions occur.
- Solana co-founder Anatoly Yakovenko published a white paper in November 2017 describing the proof-of-history (PoH) concept.
Flow is a Blockchain Network that aims to be Fast, Secure, and Developer Friendly
- Flow is a Proof-of-Stake blockchain designed to be the foundation of Web3 and the open metaverse, supporting consumer-scale decentralized applications, NFTs, DeFi, DAOs, PFP projects, and more.
- Powered by Cadence, an original programming language built specifically for digital assets, Flow empowers developers to innovate and push the limits that will bring the next billion to Web3.
- Created by a team that has consistently delivered industry-leading consumer-scale experiences including CryptoKitties, NBA Top Shot, and NFL ALL DAY, Flow is an open, decentralized platform with a thriving ecosystem of creators from top brands, development studios, venture-backed startups, crypto leaders, and more.
NEAR Protocol is a Public Proof-of-Stake (PoS) Blockchain
- that aims to bring DeFi to the masses with low transfer fees and fast transactions.
- NEAR competes with Avalanche, Solana, Cardano, Algorand, the new version of Ethereum, and other PoS networks.
- NEAR Protocol network has 18M wallets and daily transactions, 400,000 transfers at 2.4s finality, and a remarkable $0.01 fee.
- Although NEAR’s daily transaction count is three times lower than Ethereum’s, it completes transactions five times faster.
- Most importantly, the protocol’s fees are comparable to Ethereum’s Layer 2 Arbitrum or Polygon networks.
Active Users on Each Blockchain
- Well, in this section, we are going to examine the behavior of the users of each network in the period of November 7-14.
- As we can see, the activity of the users of this network was very high on November 7 and 8, and on November 10 and 11, we saw heavy user activity.
- By examining the change in the prices of tokens, we saw that November 7 was the edge of the collapse of all 3 tokens and after this date, their prices dropped sharply.
- This issue can be the answer to this heavy activity of users.
- In my opinion, users are divided into several groups. And on November 10th and 11th, when they had the biggest drop, they were disappointed with the return of the token price, and then they withdrew their assets.
- Because exactly after every day when many users have been active in the network, one day the activity has decreased drastically.
- Among the active users in this period of time, FLOW had the largest number of active users, and in the graph on the right, we can see the percentage of the majority of FLOW users compared to the rest of the networks.
- More than half of this chart belongs to FLOW users with 1.8 million users, followed by Solana with 1.1 million users, and finally NEAR with 505K active users on the network.
New Users on Each Blockchain
- As we can see, Solana had the newest users on November 9 and 10, which were 26.2K and 25.9K respectively.
- Some of the new users in Solana can be those who want to buy SOL at the lowest possible price and profit later with the price growth.
- In general, Solana and NEAR had the newest users.
- The users I gave as an example for Solana can also be applied to this pair of tokens because the price of these tokens has almost halved during their severe fall.
- In the first days, more users were added to the networks, precisely on the days when we had the most drops, many users were added.
- Also, Solana has more than 148K and NEAR with 115K and finally Flow with 44K new users.
Transactions Count on Each Blockchain
- As we can see, during the first days of Solana's severe fall, the volume of transactions of this network was extremely high and gradually decreased, among the networks, Solana had the highest number of transactions in this period of time.
- The volume of transactions is also very heavy.
- At its peak on November 7, more than 26.8 million transactions were made on Solana.
- Any transaction including a very small volume can greatly increase the 24-hour volume of the network, exactly this heavy transaction volume caused Solana's 24-hour volume to reach 6.13 billion on November 9 from 2.2 billion on November 7.
- In this short period of time, Solana has more than 155 million transactions and NEAR has more than 6.8 million transactions.
Before / After Collapse - Succesful %Rate & Average Transactions
- The success rate of transactions in NEAR has been decreasing sharply after November 7, which reached 61% on November 9, which means that only 61% of transactions have been successfully completed, and on November 10 and 11, this rate improves, but again Its percentage is decreasing and reached 83.5% as of November 14.
- The success rate of transactions in Flow is worse than that of NEAR, so on November 8, an improvement of the success rate is made, but over the course of several days, the situation worsens and decreases to the limit of 52%. This issue can cause a lot for network users. be their discomfort. This percentage has decreased so much that 50% of transactions have failed.
- Like Flow, Solana's transaction success rate has dropped the most, reaching 42% on November 9, and after that, this rate has improved in consecutive days and reached 54% by November 14, but this success rate is still The transaction is very low and if this issue is not improved quickly, more losses will be caused to the network.
- Comparing all 3 networks, Solana's transaction success rate has decreased the most, but it has improved, but Flow has decreased more.
- In comparison, the average transactions of the networks before the Collapse, Solana were more than 24 million, Flow had more than 830K and NEAR had 447K transactions on a daily basis.
- But after the collapse of Solana and Flow, they experienced the biggest drop in transactions, but NEAR transactions have decreased a little compared to them.
Before / After Collapse - Average Users & Transactions Successful %Rate
- According to the graph on the left, we can see a decrease of 20K people in the average daily active users of Solana and NEAR. But the interesting thing is the excessive growth of FLOW active users, which was 52K on average before Collapse, but after Collapse, they increased to 180K on average.
- This has been a significant growth of active users among these 3 networks.
- According to the graph on the right, we can see the decrease in the average transaction success rate in all 3 networks,
- Where NEAR can be said to have the lowest rate decrease.
- But Solana and Flow have gone from an average of 80 to below 60 after Collapse.
- This Solana transaction success rate is very bad for users with the number of daily transactions that are done in this network.
Sales Volume on Each Blockchain
- In terms of sales volume of NFTs, as you can see, the graph is divided into 2 categories, Solana and Flow, because the sales volumes of NEAR NFTs are extremely low.
- And definitely, considering the price of Solana collections, the power of sales volume has been assigned to Solana.
- In the first days, the sales volume of Solana NFTs reached 3.8 million and the next day up to 4.4 million, and reached its highest level of 4.8 million on November 9.
- After that, the sales volume of Solana NFTs will decrease drastically and until November 14, we have seen an increase in the sales volume of Solana NFTs. In the days when the prices of the collections are lower and lower, their sales volume has also increased.
- The sales volume of Flow NFTs has been extremely high in the first days, unlike Solana, and with the passing of consecutive days, its sales volume has decreased. The highest daily sales volume was on November 7 with 350K.
- NEAR, like Flow, had a higher volume of sales from its NFTs in the first days of its decline.
Buyers Count on Each Blockchain
- As we can see that in the first days of this sharp drop in the price of tokens, many buyers were active on the network, and as each day passed, their number decreased, Solana and Flow had the largest number of buyers.
- With the decrease in the price of these tokens, the price of their NFTs has also decreased and some users have sought to buy from their desired collections.
- During this period, Solana has more than 72.4K and Flow has more than 26.8K active buyers in the network.
Sellers Count on Each Blockchain
- The number of sellers is almost the same as the number of buyers, but this is the difference between the number of sellers.
- Solana's sellers outnumber its buyers by 15K, and Flow's sellers outnumber its buyers by about 1000.
- There have certainly been a large number of sellers that have created this number of buyers, but in general there have been more people who have sought to quickly sell their assets in order to save some of their profits or principal capital.
- Also, the activity of these buyers and sellers in the first days of Solana drop has been extremely high, since Solana has very good NFT collections and with this 40% price drop, many people are looking to buy the desired NFTs at the price floor.
- In general, the sharp drop in the price of tokens will affect many users' behavior.
Sales Count on Each Blockchain
- The highest number of NFT sales is first in Solana and then in Flow, in the first days of the sharp drop in the price of Solana, the number of NFT sales was extremely high, and with the passing of each day, its activity has decreased.
- In general, the number of sales of Solana's NFTs has been extremely high, on the other hand, the number of sales of Flow's NFTs has been close to Solana's and on some days, it has sold as much as half of Solana's sales. Over 263K Solana NFTs and over 132.7K Flow NFTs have been sold during this time period.
Sales AVG Volume on Each Blockchain
- As we can see, the average sales volume of Solana NFTs is much higher than the others, but the interesting thing is that the average sales volume of NEAR NFTs is higher than Flow. According to the number of NFTs and its sales volume, its average is higher than Flow. But the general trend of the graph shows us that the volume of sales of NFTs increased greatly in the first days, and its volume gradually decreased, and the main number of sales and purchases took place in the first days.
Before / After Collapse - Average Buyers & Sellers
- According to the graph on the left, we can see that the average number of buyers of Solana and FLOW NFTs was high on a daily basis before the Collapse, and after the Collapse, it experienced a heavy decrease. In general, it can be said that after Collapse, we have had a sharp decrease in buyers of all 3 networks.
- According to the graph on the right, we can see that the number of sellers of NFTs in the networks decreases sharply after the collapse.
- In general, the number of sellers of NFTs in these 3 networks is more than their buyers, even after the collapse, their number is more.
Unstakes AVG Volume on Each Blockchain
- As we can see, Flow has the highest average volume among the rest of the network in this time period, this is so that with a very low number of Unstaker and Unstake action, it has made the highest volume in the Unstake network.
- The average unstaked volume of NEAR on November 14 is also significant.
- Flow and NEAR networks have unstaked very heavy volumes in their networks in the days after the sharp drop in prices, and considering the small number of unstakers in the networks, it can be said that these unstaked volumes were for people with very heavy assets.
Before / After Collapse - Sales Count & Volume
-
Looking at the chart on the left, we can see that Solana averaged 40.4K daily, Flow 20K, and NEAR 130.1 on normal days, but after the Collapse, we had a sharp drop in the number of NFT sales in all 3 networks.
-
Solana's average has reached 30K, Flow has reached 14.9K, and NEAR has reached 97.2, and this has been a sharp decline in NFT activity.
\
-
According to the graph on the right, the average sales of all 3 networks after the Collapse have decreased significantly compared to their normal days. Before the Collapse, Solana's daily average was 3.2 million, Flow 361K, and NEAR 4.4K, and after the Collapse, Solana decreased to 2.8 million, Flow to 239K, and NEAR 2.5K.
-
Compared to the average sales volume of all 3 NEAR networks, it has decreased significantly.
Unstakes Volume on Each Blockchain
- On November 7, as the prices continue to fall, Solana and Flow have the largest volumes. Contrary to the high number of NEAR Unstakes on the same day and its low volume, we can see that they included low volumes.
- On November 8, following the confirmation of the price drop, very heavy volumes were unstaked in Solana and NEAR, and this increase in unstaked volumes continued until November 10.
- On November 11th, the highest unstaked volume per day belongs to Flow and on November 14th, the highest unstaked volume is compared to the other 2 networks. NEAR has the highest volume in this time period.
- Flow and NEAR have been unstaked on a daily basis, but in 2 days, a very heavy volume has been unstaked in these networks.
- But in general, in this time frame, Solana 41.9 million, NEAR 32.6 million, and Flow 20.2 million are their unstaked volumes these days.
Active Unstakers on Each Blockchain
- As we can see, few Unstakers are active on the network in the first days, but on November 9th and 10th, many Unstakers are active on the network.
- In this period of time, NEAR has continuously had a certain number of Unstaker on its network, but on November 9th, this number will increase.
- And Flow's Unstakers have increased and decreased on a daily basis, but on November 14th, we had the highest number of Unstakers on FLOW and the rest of the networks.
- In general, Solana and NEAR have had significant unstakers in general, if we do not consider Flow's extreme spike on November 14.
- In the graph on the right, we can see that Solana had as many Unstakers as Flow and NEAR in this time frame.
- Solana has over 1903, NEAR over 1123, and Flow over 903 Unstaker in this time frame.
Unstakes Action on Each Blockchain
- On November 7th, the number of Unstakes in Solana and Flow was very low compared to NEAR, but the next day we saw the growth of Unstakes in Solana until November 10th.
- This network has experienced the highest number of Unstake in these few days and after that the number of Unstake on this network has decreased.
- NEAR has increased against Flow and Solana in just one day, on November 9 there were over 334 Unstakes on NEAR.
- Due to the high activity of its users on November 14, Flow has done a lot of Unstake on this day.
- In general, by examining the trend of the graph, except for Flow, the largest number of Unstakes on the days when the heavy drop in the price of these tokens has been confirmed and users have no hope of the return of the price have unstaked their assets on the networks.
- In this period, Solana has more than 3267, NEAR has about 1531, and Flow has 1022 Unstakes.
Before / After Collapse - Average Unstakes Action & Volume
-
According to the graph on the left, we can see that before the Collapse, the number of Unstakes in Flow and Solana networks is very low.
-
But in NEAR, before Collapse, Unstakes was also done.
-
But after the Collapse, Unstake action has increased strongly in all 3 networks, but it has increased more than all networks in Solana.
\
-
In the graph on the right, we can see that the average daily volume of Unstake after Collapse has increased sharply in all 3 networks,
-
And Solana has reached 3.9 million daily Unstake volume from 1 million.
Share of NEAR, FLOW & Solana Transactions by Their Volume
-
In the NEAR network, before the Collapse, the majority of Unstake transactions had volumes equal to $100-1000, and after them, the majority of $100-100 and people who had more than $1000 had a significant number. But after Collapse, the number of transactions has been decreasing, and the majority of transactions had volumes of $100-1000 and $100-10.
-
In the Flow network, before the collapse, the majority of Unstake transactions were with volumes of more than $1000, after that, the majority of transactions were with $100-1000.
-
But after the Collapse, the number of transactions has increased, and the majority of Unstake transactions were with $100-1000, and compared to before the Collapse, the number of transactions in the network was more than $1000.
-
In the Solana network before the collapse, the majority of transactions had volumes of more than $1000, and a small number of transactions included the rest of the volumes. But after the Collapse, the number of Unstake transactions has increased drastically, and the majority of transactions have had volumes equal to more than $1000, and after that we have had volumes of $100-1000.
-
In general, by examining the volume of NEAR transactions, we can see that before the collapse, more people were willing to unstake their assets, and the majority of them unstaked their assets with transactions of $100-100 and $100-1000.
\
-
By examining the transaction volumes of Flow and Solana, we can see that after Collapse, users tend to unstake their assets, and the majority of Flow users have withdrawn their assets with transactions of $100-1000, and on the other hand, Solana users with volumes They have withdrawn with more than $1000, among which there can be many whales because the volume of Unstake in Solana is very high.
Active Swappers on Each Blockchain
- As we check, most of the Swappers belong to Solana, and Solana Swappers have gradually increased in the first days, and after November 9, their number gradually decreased.
- Solana's highest swapped volume must have been done during this period when many swappers were active on the network.
- Because there is a big difference between the number of swappers in the networks, we will check them separately.
- Flow Swappers gradually increased in the first days, and after November 10, most of them decreased, but on November 13 and 14, we see an insignificant increase in the number of Flow Swappers.
- NEAR Swappers have acted like Solana, their number has increased in the first days and after November 9th they have mostly decreased and the number of NEAR Swappers has had a steady trend throughout the week. In this time frame, Solana has more than 126K, NEAR has more than 4215 and Flow has 1116 Swappers.
Swaps Count on Each Blockchain
- According to the graph on the right, the majority of swaps were done on the Solana network, and on November 8-10, this network had the highest number of swaps, and after this date, the number of swaps decreased.
- The Flow network also had the highest number of swaps on November 8-9.
- The NEAR network, like Flow, had the highest number of swaps on November 8-9.
- In general, Solana has been the most active network in Swap, and according to the graph on the left, we can see the heavy volume of Swaps in this network.
- Solana alone has done more than 3.5 million swaps on this network during this time period.
- In the next section, as expected, Solana should account for the most swapped volume, let's check.
Swaps Volume on Each Blockchain
- As we can see, crazy volumes have been swapped in Solana in the first days, so on November 8 and 9, this network has more than 512 million swaps.
- NEAR and Flow networks have a lot of swapped volumes these days. By checking the average volumes,
- We can check the influence of the swapped volumes of the networks.
- Most of the swapped volumes were done in the first days, and in the next sections, we are going to check the destination of the swaps.
- Solana has swapped 934 million volumes during this time frame, exactly over half of that volume on November 8th and 9th alone.
- NEAR has also swapped more than 59.8 million volumes in this period.
- Flow has also swapped more than 6.1 million volumes.
Swaps AVG Volume on Each Blockchain
- On the days mentioned in the previous section, we can see that Solana had the highest average volume on these days,
- But why is the average of NEAR and Flow higher?
- Because compared to the number of Swappers and the number of Swaps, the average volumes that have been swapped in the NEAR and Flow networks are more.
- In Flow, we had the highest average swapped volume on November 10, while NEAR had the highest average swapped volume on November 8 and 10.
Before / After Collapse - Average Swappers & Swaps Volume
- According to the graph on the left, we can see that the number of Solana Network Swappers has increased significantly after the Collapse. On the other hand, the number of Swappers of the NEAR network has increased significantly after the Collapse.
- Flow Swappers, like NEAR, have not grown much after Collapse.
- But according to Solana's condition, Collapse has had the greatest impact on it.
- According to the graph on the right, we can see that the average volume of swapped in Solana has increased by about 3 times after the collapse, and its average shows a very heavy volume of swapped after the collapse.
- On the other hand, the average swap volume of NEAR has increased by 1 million after the collapse.
- And finally, the average swapped volume of Flow has doubled after the collapse.
Stablecoins - Each Blockchain Swappers by Their Action
-
In the NEAR network, the majority of Swappers intended to Swap From Stablecoins, their number increased sharply on November 8 and 9, and during the entire week, the number of Swappers who intended to Swap From Stablecoins was higher.
\
-
In the Flow network, there are more Swappers who intend to Swap From Stablecoins, and this superiority has been the number in our entire time frame.
\
-
In Solana, the number of Swappers doing Swap From Stablecoins is clearly more than Swap To Stablecoins, so that on November 9, we had more than 16.8K Swap From Stablecoins and more than 9126 Swap to Stablecoins. And we have had this advantage of Swap From Stablecoins during the week
Stablecoins - Each Blockchain Swaps Count by Their Action
-
In the NEAR network on November 8th and 9th, in general, the majority of transactions were for Swap To Stablecoins, but on some days, the distance between Swap To and Swap From was very small, but Swap To has more superiority in NEAR.
-
In the Flow network, unlike NEAR, the majority of transactions were for Swap From Stablecoins, which reached their maximum on November 8 and 9, and the distance between Swap From and Swap To in this network can be clearly identified and the superiority of Swap From Stablecoins.
\
-
We can see the clear superiority of Swap From Stablecoins in the Solana network over any other network. On November 8-10, we had the most Swap between Stablecoins, the majority of which were Swap From Stablecoins.
Share of NEAR, Flow & Solana Transactions by Their Volume
- In NEAR, the majority of Swap transactions, the majority of transactions were performed with volumes equal to $100-1000, and after with volumes equal to $100-100, but after Collapse, transactions with volumes of $100-1000 $ have increased, as well as transactions with a volume of more than $1000.
- In Flow, the majority of swap transactions before the collapse had volumes equal to $100-1000, and after the collapse, most of the transactions with different volumes have been decreasing, but transactions over $1000 have increased.
- In Solana, before the collapse, the majority of transactions were with volumes equal to $10-100, but after the collapse, the majority of transactions were less than $10, and after that, transactions of $10-100 and more than $1000 increased. Is.
- In all 3 networks, the transaction volume is more than 1000$, this shows the heavy outflow of volumes with Swap in the networks.
Stablecoins - Each Blockchain Swaps Volume by Action
- In the NEAR network, due to the superiority of the number of Swap To Stablecoins transactions, we have had more volumes in Swap From Stablecoins. We had the highest volume of Swap From on November 8-10, so on November 10, the volume of Swap From Stablecoins was more than 7.2 million. In general, in the first days, we had a strong pump in Swap From, and over time, the volume of Swaps decreased, and during the week, the volume of Swap From Stablecoins was higher than Swap To.
- On the Flow network, significant volumes of Swap From Stablecoins were made on November 8-10, and these volumes decreased in the following days, but the majority of volumes belonged to Swap From Stablecoins.
- On the Solana network, very heavy volumes were swapped on November 8 and 9, and the majority of these volumes were swapped from stablecoins. On some days, Swap From and Swap To volumes converged, but during this time frame, the majority of volumes were Swap From Stablecoins.
Before / After Collapse - Stablecoins NEAR Average Swaps & Volume
-
Before the Collapse, the majority of transactions were with Swap From Stablecoins, but after the Collapse, the majority of transactions were changed to Swap To Stablecoins. And the average Swapa From Stablecoins transactions has decreased.
\
-
On the right side, we can see that after the Collapse, although the majority of transactions were with Swap To Stablecoins, the average volume of Swap From Stablecoins maintained its superiority after the Collapse.
\
-
This shows that the majority of NEAR users are willing to transfer their assets with Swap From Stablecoins.
Before / After Collapse - Stablecoins Flow Average Swaps & Volume
-
In the Flow network, before the collapse, the average transactions were with Swap From Stablecoins, and after the collapse, the majority of the average transactions were with Swap From Stablecoins. But in general, we can see the growth of the average transactions of both swaps.
\
-
On the right side, we can see the average volumes of this network before and after the collapse, before the collapse, the majority of the volumes belonged to Swap From Stablecoins, which increases sharply after the collapse.
\
-
It can also be said that Flow users also tend to transfer their assets with Swap From Stablecoins.
Before / After Collapse - Stablecoins Solana Average Swaps & Volume
-
In the Solana network, as we can see, the average transactions of Swap From Stablecoins were higher before and after the Collapse. We can also see the average number of transactions of Swap From Stablecoins after the Collapse, which has greatly increased, and compared to the average Swap To, it has grown more significantly.
-
On the right side, we can see the average volume of Swap of this network, before and after the Collapse, the majority of it was with Swap From Stablecoins. And like the average number of transactions, the volume of Swap From Stablecoins has increased sharply after the Collapse.
\
-
The Solana network has had a greater increase in the average number and volume of Swap From Stablecoins compared to the rest of the networks after the Collapse. This indicates that Solana users tend to convert their holdings into other currencies. But there are also a significant number of Solana users who prefer to convert their assets into Stablecoins without risk.
Source
- What is NEAR? What is Solana? What is FLOW?
- The Collapse of FTX
- Check the links above if you want to know more about NEAR, Solana, Flow Blockchains & The Collapse of FTX.
Results
Total Users Activity on Each Blockchain
According to our research, Flow had the most active users in the period of November 7-14, followed by Solana, among the networks during these 7 days, Solana added the newest users. Flow users on a daily basis are much more than Solana users, but Solana users have made an extremely large number of transactions in this short period of time. The rate of successful transactions in Solana has dropped more than other networks during the week, and for a network that has 14.5 million or more transactions daily, the rate of successful transactions of 42-54% annoys users a lot. Also, after the Collapse, we saw that the number of daily active users of the networks increased and the successful transaction rate decreased drastically. In general, Solana has received many shocks in a short period of time, and these events and the sharp drop in its price have caused it to move to the lower ranks in the list of the most popular currencies.
NFT Activity on Each Blockchain
According to the reviews, as we have seen, Solana and Flow networks have the largest number of buyers and sellers among the networks. The sales of NEAR NFTs during this period had a small growth in the first days, but eventually decreased, also the sales volume of NEAR NFTs in the first days decreased from 4.7K to 1.4K. But in general, the NFTs of the networks have had a large number of buyers and sellers in the first days, as well as a lot of sales (in the direction of the price drop, a series of users are looking to buy NFTs and convert their capital into NFTs. Due to the decrease of buyers and The sellers after Collapse and the number of sellers being higher, it can be concluded that they are users who want to cash out their NFTs so as not to suffer more losses, but on the other hand, some people see this as a good opportunity and are looking to buy. NFTs are after the price collapse, but overall the Collapse has had a very negative impact on the NFT market of each network.
Unstakers Activity on Each Blockchain
Compared to the networks, Solana had the highest number of Unstaker, and the highest number of Unstakes was first in Solana, followed by NEAR. In this period of time, Unstakes have been done daily, and only on November 9, we had the highest number of Unstakes in this network, and the largest Unstaked volume of this network was on November 14, which is the highest volume among this time period. After the Collapse, the average Unstakes transaction and its volume have increased, and it can be said that users tend to Unstake their assets, according to the date that the Unstake spike was NEAR, in my opinion, a part of those who Unstake, because the graph The price of NEAR has been falling with a great slope due to the resistance that was rejected at the price of $2.02. Users have made their decision and believe that the price will fall more, so they have unstaked their assets.
Swaps Activity on Each Blockchain
According to the research, we saw that NEAR had limited Swappers on a daily basis during this time period, which were most active on November 8 and 9. On the 8th to 10th of November, there were very heavy volumes in the Swap network, so that in these 3 days there were more than 39.4 million swaps. After Collapse, the average number of NEAR Swappers has not increased significantly, but it has been added to the daily swap volume of this network. In NEAR, the majority of transactions whose volumes were more than $1000 have increased, and this can indicate the heavy volumes of Swap in this network.
Stablecoins Swap Destination
In general, based on the number of swappers and the number of transactions, it can be said that NEAR users tend to swap their assets to stablecoins, but the volume of swappers who do swap from stablecoins is much larger, but in general, NEAR users tend to swap to stablecoins. have.
Flow and Solana users behave almost the same and based on the transaction and Swapper, the majority do Swap From Stablecoins, but still there are a number of users in both networks who prefer Swap To Stablecoin.
In general, after Collapse, the number of transactions and the volume of NEAR, Flow, and Solana have increased, and users tend to convert their assets to other currencies or to Swap Stablecoins.
In general, after the collapse, we have seen the loss of these networks, and the majority of users are generally looking for the withdrawal of their assets from these networks, because the issues that we have examined have led to the withdrawal of assets from the network by the majority of users.
-
Hope You Enjoyed ❤
\
-
Dashboard Tweet link:
Credit: with help alik110
What Are We Looking For? 🔍
In this dashboard, We will be focused on Total Users Activity on Each Blockchain, NFT Activity on Each Blockchain, Unstakers Activity on Each Blockchain, Swaps Activity on Each Blockchain, and Stablecoins Swap Destination In this case, the metrics analyzed are:
- Total Users Activity on Each Blockchain
- Active Users on Each Blockchain, New Users on Each Blockchain
- Transactions Count on Each Blockchain
- Before / After Collapse - Succesful %Rate & Average Transactions
- Before / After Collapse - Average Users & Transactions Successful %Rate
- NFT Activity on Each Blockchain
- Buyers Count on Each Blockchain, Sellers Count on Each Blockchain
- Sales Count on Each Blockchain, Sales Volume on Each Blockchain
- Sales AVG Volume on Each Blockchain
- Before / After Collapse - Average Buyers & Sellers
- Before / After Collapse - Sales Count & Volume
- Unstakers Activity on Each Blockchain
-
Active Unstakers on Each Blockchain
-
Unstakes Action on Each Blockchain, Unstakes Volume on Each Blockchain
-
Unstakes AVG Volume on Each Blockchain
-
Before / After Collapse - Average Unstakes Action & Volume
-
Share of NEAR, FLOW & Solana Transactions by Their Volume
\
-
- Swaps Activity on Each Blockchain
-
Active Swappers on Each Blockchain
-
Swaps Count on Each Blockchain, Swaps Volume on Each Blockchain
-
Swaps AVG Volume on Each Blockchain, Swaps AVG Volume on Each Blockchain
-
Share of NEAR, Flow & Solana Transactions by Their Volume
\
-
- Stablecoins Swap Destination
-
Stablecoins - Each Blockchain Swapper by Their Action, Stablecoins Swaps Count by Their Action
-
Stablecoins - Each Blockchain Swaps Volume by Action, Stablecoins Swaps Volume by Action
-
Stablecoins - Each Blockchain Swaps Volume by Action
-
Before / After Collapse - Stablecoins Solana Average Swaps & Volume
\
-
- Results
Active Users on Each Blockchain
New Users on Each Blockchain
Transactions Count on Each Blockchain
Before / After Collapse - Succesful %Rate & Average Transactions
Before / After Collapse - Average Users & Transactions Successful %Rate
Buyers Count on Each Blockchain
Sellers Count on Each Blockchain
Sales Count on Each Blockchain
Sales Volume on Each Blockchain
Sales AVG Volume on Each Blockchain
Before / After Collapse - Average Buyers & Sellers
Before / After Collapse - Sales Count & Volume
Active Unstakers on Each Blockchain
Unstakes Action on Each Blockchain
Unstakes Volume on Each Blockchain
Unstakes AVG Volume on Each Blockchain
Before / After Collapse - Average Unstakes Action & Volume
Share of NEAR, FLOW & Solana Transactions by Their Volume
Active Swappers on Each Blockchain
Swaps Count on Each Blockchain
Swaps Volume on Each Blockchain
Swaps AVG Volume on Each Blockchain
Before / After Collapse - Average Swappers & Swaps Volume
Share of NEAR, Flow & Solana Transactions by Their Volume
Stablecoins - Each Blockchain Swappers by Their Action
Stablecoins - Each Blockchain Swaps Count by Their Action
Stablecoins - Each Blockchain Swaps Volume by Action
Before / After Collapse - Stablecoins NEAR Average Swaps & Volume
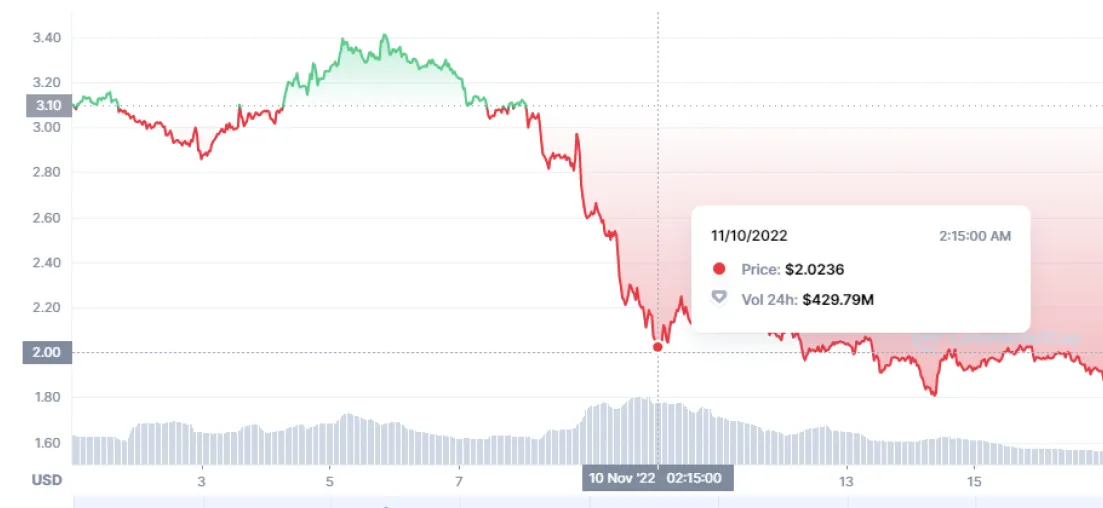
NEAR Token Price Changes 2 Weeks ago
- As we can see, in the beginning of November, the price of this token had a noticeable pump from $2.8 to $3.4, and on November 5-7, it kept this price up to $3.1, but due to the recent events of this token, its price has greatly increased. It broke and hit a low of $2 on November 10.
- After touching this price, a resistance was created that lasted less than a day and this resistance was broken again and fell to $1.8 and this price level became a resistance, and has been able to keep this price until today.
- Between November 7 and 10, this token's network volume increased dramatically. And after touching the lower prices, its 24-hour volume has decreased drastically.
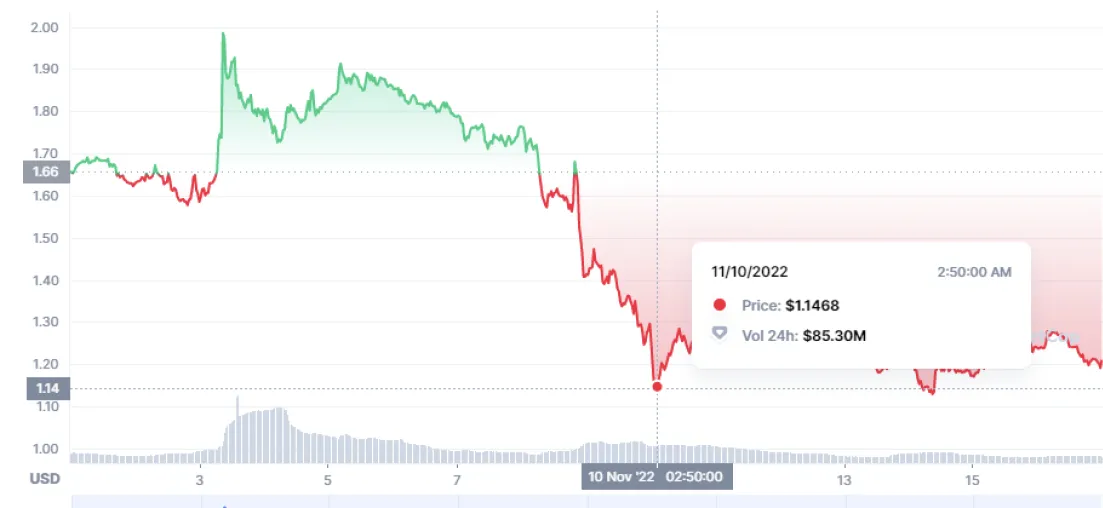
Flow Token Price Changes 2 Weeks ago
- Flow, like NEAR, had a price pump from $1.5 to $1.9 in early November. Flow held around this price from November 3rd to November 7th,
- but with a sharp drop, its price reached $1.1. The lowest price of this token was on November 10, and this price range has become a resistance and to some extent, it has been able to keep the price above it, but on November 14, this price will be touched and a second resistance will be created, and the price will be moving above this limit.
- The 24-hour volume of this token has increased greatly in its extreme downtrends, and this volume is due to things like Unstake and the output of assets of users of this network.
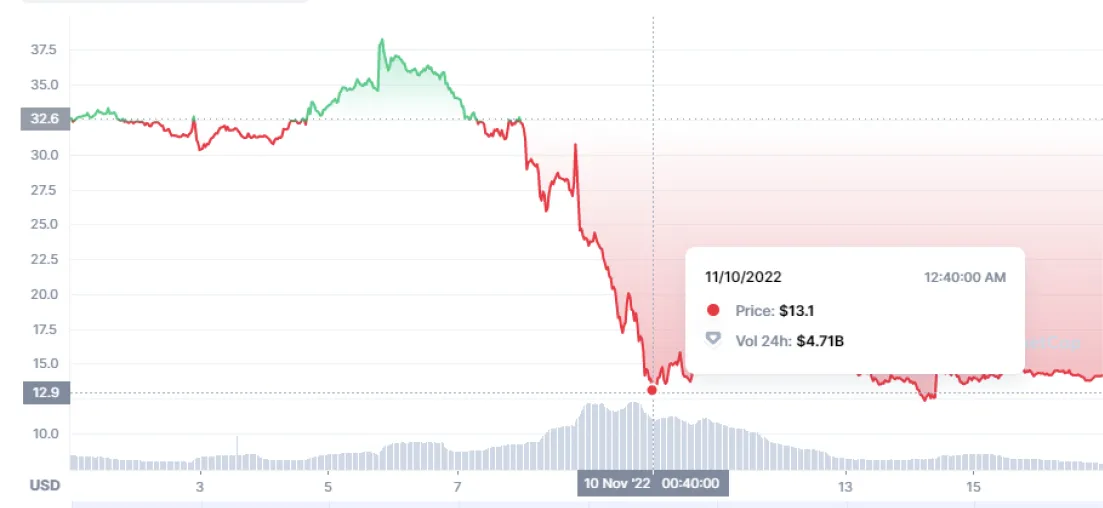
Solana Token Price Changes 2 Weeks ago
As we can see according to Solana's price chart on CoinMarketcap, we can see that Solana had a small pump up to $31, and a sharp drop starts from November 8.
This heavy drop continued for 2 days.
On November 9, we dropped to $13.8, about 44% compared to the previous day. This is a heavy drop for this network and its users.
And this fall has continued to $12.6 on November 10, and a position has been created on this number, which was able to keep Solana's price above it for several days.
But in the next 4 days, this resistance was broken, and we fell to $12.38.
And this number itself has become a resistance, and we have not come close to this number until today.
The Collapse of FTX
- Cryptocurrency exchange FTX filed for Chapter 11 bankruptcy protection on Nov. 11, 2022 after a swift fall from grace. The company's valuation plunged from $32 billion to bankruptcy in a matter of days, dragging down founder and CEO Sam Bankman-Fried's $16 billion net worth to near-zero.
- FTX's collapse shook the volatile crypto market, which lost billions in value, dropping below $1 trillion.
- The consequences of FTX's rapid decline and collapse will likely impact cryptocurrencies well into the future and could even drag down broader markets.
- On November 16, a class-action lawsuit was filed in a Florida federal court, alleging that Sam Bankman-Fried created a fraudulent cryptocurrency scheme designed to take advantage of unsophisticated investors from across the country.
- Other celebrities named in the lawsuit include Steph Curry, Shaquille O'Neal, Shohei Ohtani, Naomi Osaka, Larry David, and Kevin O'Leary who allegedly helped Bankman-Fried facilitate the plan.
- The U.S. House Financial Services Committee said it will hold a hearing in December 2022 on the FTX collapse.
What Went Wrong with FTX?
- Cryptocurrency exchange FTX collapsed in early November 2022 following a report by CoinDesk highlighting potential leverage and solvency concerns involving trading firm Alameda Research.
- FTX faced a liquidity crisis and a search for bailout funds; rival exchange Binance considered buying portions of the company but quickly backed out.
- By Nov. 11, FTX's CEO stepped down and the company filed for bankruptcy.
- In the hours following, FTX experienced a possible hack in which hundreds of millions worth of tokens were stolen.
Before / After Collapse - Stablecoins Flow Average Swaps & Volume
Before / After Collapse - Stablecoins Solana Average Swaps & Volume