Impact of FTX & Alameda on Solana Ecosystem and FTX,Alameda-Invested Tokens
How has the recent tumult surrounding FTX and Alameda impacted SOL and the Solana ecosystem?


Alameda Research
Alameda Research Ventures (ARV) is a multi-stage crypto and fintech investment firm with a mission to take a pragmatic, real-world oriented approach to finance - making it more accessible for all.
Sam Bankman-Fried (SBF)
Sam Bankman-Fried, also known by his initials SBF, is an American entrepreneur and one of the richest people in crypto thanks to his FTX exchange and Alameda Research trading firm. He is CEO and Founder of FTX and also Alameda Research. The son of two Stanford law professors, he studied physics at MIT but was drawn to "effective altruism," the utilitarian-inflected notion of doing the best possible.
Introduction
Without any doubt, The hottest topic during the recent weeks in the cryptocurrency market was the bankruptcy of FTX and Alameda. In recent days, I have done several analyses about this topic and the impact of FTX & Alameda collapse on different chains and ecosystems which you can find some of them below:
(Whos Escpaing FTX)
(Impact on Axelar Satellite Bridge)
(Impact on NEAR Protocol and Comparing With Other L1s)
(Impact on Ethereum’s Uniswap and Sushiswap)
(Impact on Optimism Velodrome and Quix Marketplaces)
(Impact on Osmosis Chain)
(Impact on Solana Staking Behavior)
(Impact on Ethereum and In & Out Flows on Ethereum <==> FTX)
(Tracking the Stablecoins Inflow and Outflows on Solana/Ethereum <==> FTX)
Methodology
In this dashboard and on the occasion of this crisis, I am going to check how this tumult surrounding FTX and Alameda impacted SOL and the Solana ecosystem.
For this purpose, Firstly, I am going to analyse overall metrics on Solana ecosystem (transactions, users) before and after FTX Collapse.
Then, I am going to check SOL and all other Solana token transfers to Alameda and FTX Wallets and also Centralized Exchange (CEXs) except FTX and also check which assets had the most outflow and inflow activity during the collapse and where was the destination of outflows from CEXs.
Then, I am going to check the flow of SOL, SRM and GMT tokens (which were listed among assets that FTX and Alameda invested in them) on Solana ecosystem before and after the collapse timespan.
Then, I am going to analyze swap activity on Solana during this timespan and especially for SOL, SRM, and GMT tokens.
Then, I am going to analyze Solana <=> Ethereum bridge activity via Wormhole during recent days,
The timespan for this bounty is set from 3 weeks ago till today to be able to compare data from days before the FTX & Alameda collapse till today and check how Solana has recovered itself after this crisis.
-
SOL: So11111111111111111111111111111111111111112
-
SRM: SRMuApVNdxXokk5GT7XD5cUUgXMBCoAz2LHeuAoKWRt
-
GMT: 7i5KKsX2weiTkry7jA4ZwSuXGhs5eJBEjY8vVxR4pfRx
\
Based on the above charts, the majority of assets were transfered out of FTX on 12th November while the main outflow was started since 7th November (1 day before the main market price crash).
About CEXs, we can also see the highest spike of outflow volume from these platforms on 12th November. Moreover, yesterday (18th November) we can see another high spike of both inflow and outflow from to CEXs.
In terms of SOL, we can see the majority of inflow and outflow of this token has achieved on 11th November and it has started mainly after 8th November.
After and before these days, we can see way less activity of SOL deposits and withdrawal to/from CEXs.
Totally, we can see the negative net flow of SOL token in majority of days meaning that most number of transfers are from Solana ecosystem to the CEXs.
Based on the left charts, we can see that most number of both inflow and outflow of Solana tokens from/to CEXs were done with $10 - $100 volume.
In terms of SOL token, we can see the majority of deposits and withdrawal to the CEXs were done with 1 - 10 SOL volume.
On the above charts, as we have seen earlier on the previous charts, the most number of both inflows and outflows from/to CEXs has achieved on 9th November and the trend line after this date (number of transfers) is negative in both paths.
Moreover, as time goes on, we can see an increasing share of inflows with low volume (less than $100) to the CEXs. This means that mainly regular users transferring their assets to the CEXs are not whales.
In terms of outflows, we can see decreasing share of outgoing transfers with less than $10 volume from CEXs and on the other hand, increasing share of withdrawals with high volume especially more than $1000. So, during recent days, we can see more whale activity of SOL outflows.
for SOL Inflows to the CEXs, as like as other tokens, the most number of both inflows and outflows have achieved on 9th November. Moreover, we can see quite increasing share of deposits with 10 - 100 and more than 100 SOL as time goes on especially after 8th November (after the collapse) and on the other hand, decreasing share of deposits with 1 - 10 SOL and less than 1 SOL.
Based on the above charts, Binance exchange has the highest share of Outflows destinations from FTX and Alameda wallets in both terms of number and volume of withdrawals.
Moreover, we can see Binance exchange was the most popular destination of outlfows from FTX & Alameda wallets till 9th November but suddenly after this date, there is significant increasing share of Coinbase exchange.
But anyway, the deposits and withdrawals was only available till 12th November and after this data, there is no data about these actions on FTX & Alameda wallets because of their bankruptcy !
According to the above charts, USDC is by far the most withdrawed assets from FTX & Alameda wallets to the Solana ecosystem. Also, the majority of transfers from other CEXs to the Solana ecosystem belong to the USDC. (charts are logarithmic so difference between volume are so higher that what u see).
In terms of inflows, we can also see USDC is the most deposited asset to the Alameda, FTX and also other CEXs. USDT and SOL are on the next ranks.
Firstly on the left chart, we can see SOL, GMT and SRM price over time. As we see, After 6th November the price of all 3 tokens have decreased dramatically.
but since 14th November, SRM token was able to recover part of its lost value while SOL and GMT still have low prices compared to the days before the collapse.
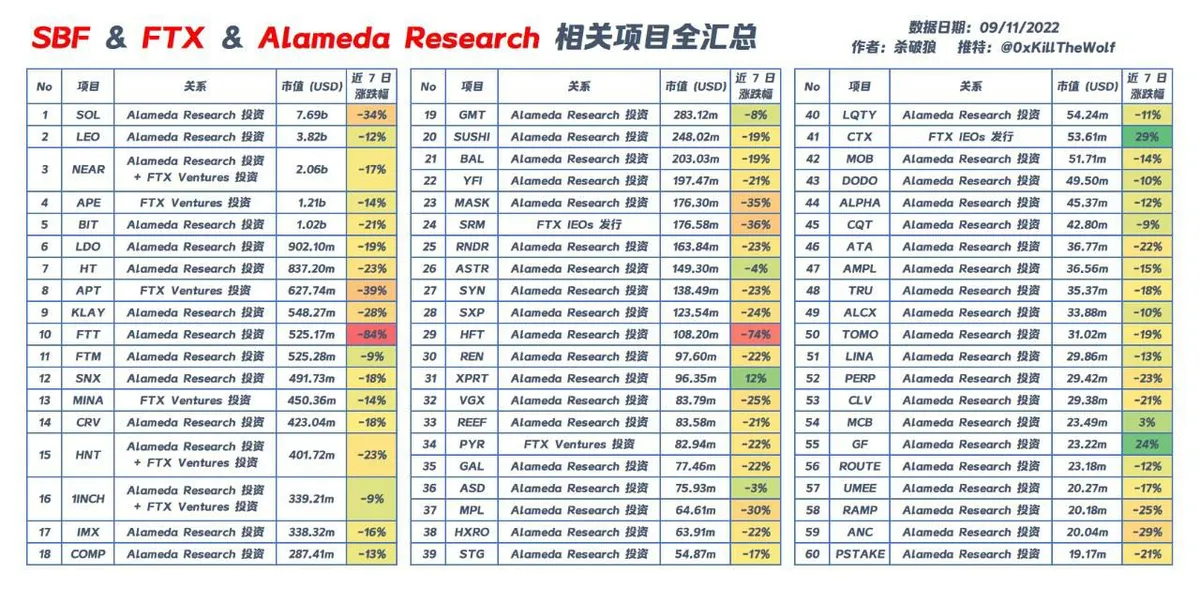
I have extracted the list of assets which SBF, FTX and Alameda Research have invested in them (the right image).
As we see, SOL is the first rank of this list with more than 7.69B USD and we have also SRM (176M USD) and GMT (283M USD) on this ranking.
So, I am going to analyse the activity of these tokens on the Solana ecosystem and especially swap programs during the FTX & Alameda Collapse.
on the above charts, we can see the swap activity on Solana ecosystem (all assets). as we see, the number and volume of swaps increased dramatically after 8th November especially in terms of volume that the highest spike of swaps was achieved on 9th November with more than 300M USD ! But after a few days, we can see the overal decreasing trend of swaps activity on Solana DEXs as time goes on especially in terms of volume.
Based on the above charts, we can see the huge increasing activity of swaps to and from SOL token to other assets since 8th November. highest number of SOL swaps achieved on 8th November but the number of swappers and also volume of swaps on 9th November is more than other days. In addition, we can see a quite an increasing trend of average SOL Swaps volume to the extent that on 10th November, we can see highest spike of average SOL swaps volume.
Moreover, we can see as time goes on , the number of swaps from SOL to other tokens is increasing dramatically. but the difference between volume of swaps from SOL & volume of swaps to SOL is less than the swaps count (Swaps from Volume have more volume in almost all days). So, We can say swappers are losing their trust in SOL token and tend to swap it to other tokens and their number and volume is increasing as time goes on.
On the left chart, we can see as time goes on, the number of swaps with less than 10 SOL volume is increasing in both swap from and to SOL meaning that there is less whale activity on SOL swaps over time.
Based on the above charts,similar to the SOL token, we can also see the huge increasing activity of swaps to and from SRM token to other assets since 8th November. highest number and volume of SRM swaps achieved on 13th November but the number of swappers on 13th November is more than other days. In addition, we can see quite increasing trend of average SRM Swaps volume till10th November.
As time goes on, the share of swaps from SRM is decreasing and the share of swaps to SRM is increasing over time. But in terms of volume, we can see again increasing share of Swaps from SRM after 14th November.
On the left charts, we can see increasing share of swaps with less than 10 SRM volume as time goes on especially in terms of volume.
SOL
SRM
GMT
Based on the above charts, similar to the SOL and SRM tokens, we can also see the huge increasing activity of swaps to and from GMT token to other assets since 8th November. highest number of GMT swaps and swappers achieved on 8th November but the volume of swaps on 9th November is more than other days. In addition, we can see the average volume of GTM swaps on 17th November is more than other days.
Aso, we can see totally the number and volume of swaps to GMT is more than swaps from GMT.
On the left chart, we do not see any specific trend of a volume-type swap on GMT over time.
On the left chart, we can see increasing activity of Ethereum to Solana on 9th November with a high spike of 35.40M USD volume.
The average volume of bridges from Ethereum to Solana has increased significantly on these days.
But, the volume of bridges is way less than bridges from Solana to Ethereum (below charts)
According to the left charts, we can see a significant increasing share of USDC bridges from Ethereum to Solana after 2nd November and its getting more and more as time goes on.
And similar to the previous chart, we can see also quite increasing share of USDC bridges from Solana to Ehtereum after 2nd November especially on 18th November that almost more than 99% of all bridges belong to this asset !
Summary and Conclusion
- The transactions and also users’ activity on Solana ecosystem has decerased dramatically after the FTX Collapse and also there are low number of new-first time users during recent days compared to the days before Collapse.
- The success rate of Solana transactions has decerased signifnicatlny after the collapse timespan and its transactions are almost 20% less successful than transactions before the collapse.
- The total net flow to/from CEXs (and ofcourse FTX and Alameda) during the timespan of the analysis is negative. this negative amount is for all tokens including SOL.
- The total net flow of tokens including SOL from this ecosystem to the centralized exchanges is also negative meaning that there are more and more money transfering out of Solana.
- As time goes on, more high-worthy withdrawals are being done from CEXs.
- Coinbase and Binance are the most 2 popular destinations of withdrawals from FTX and Alameda. The deposit and withdrawal just halted after 12th November because of bankruptcy.
- USDC, USDT and SOL are the most deposited/withdrawn assets from/to Alameda, FTX and CEXs to/from Solana ecosystem. but USDC difference is way more than other assets.
- SOL, SRM and GMT tokens are the top 3 Solana ecosystem assets that Alameda and FTX have invested on them. all 3 experienced massive crash on their price during collapse days but SRM has done better in recovering its lost value.
- The flow of SOL and SRM (especially SRM) has increased significantly within the Solana ecosystem after the collapse but the GMT token has less activity compared to the days before the collapse.
- Solana ecosystem swap activity increased dramatically after 7th November in both number and volume.
- As time goes on, The number and especially volume of swaps from SOL to other tokens is increasing significanlty meaning that users are losing their trust in this token and prefer to swap out it to other tokens.
- On the other hand, There was increasing share (especially in terms of number) of swaps to SRM as time goes on but the volume of swaps from this token has increased again after 14th November.
- The number and volume of bridges from Solana to Ethereum has increased dramatically since 2nd November. USDC is the most bridged asset from Solana to Ethereum. may.be this means users have lost their trust in Solana and tend to bridge their asset to a safer blockchain. Also, another reason behind this high activity of bridges from Solana to Ethereum especially on 17th November can be because of suspending Solana USDC and USDT assets deposits on exchanges such as Binance and OKX. On the other hand, Tether has announced on 18th November that they are going to bridge 1B USD from Solana to Ethereum.
Totally, The above analysis shows that the situation on Solana ecosystem and its native token, SOL, is not good at all since the activity on this ecosystem is decreasing over time and also there are more and more assets being bridged from Solana to other platforms.
Discord: Ali3N#8546 Twitter: Alik_110 Tweet Link For This Dashboard:
On the above charts, we can also see quite increasing number and volume of bridges from Solana to the Ethereum since 7th November. Also, there is another huge high spike of bridges from Solana to Ethereum on 17th November.
Maybe this can be users have lost their trust on Solana and tend to bridge their assets to a more safe blockchain like Ethereum.
Overall Solana Ecosystem Stats
Based on the above charts, the number of transactions and also active users on Solana ecosystem has decreased significantly after the FTX & Alameda collapse.
We can see high spikes of users activity on Solana ecosystem during first days of collapse (8 - 10 November), But After that, we can see decreasing trend of active users on this chain as time goes on.
Moreover, in terms of New users, we can see significant decreasing trend of new first-time users on Solana ecosystem as time goes on.
So, the above metrics, are not good news for this chain at all coz the trend line of all metrics was quite decreasing …
As a more clear visualisation, we can see the average number of transactions, active users and also new users before collapse timespan was way more than the timespan after collapse.
In terms successful rate of transactions, we can see dramatical decrease in success rate of transactions after the collapse timespan.
As we see, the drop on the success rate of transactions has strated since the first day of collapse but its kinda recovering over time.
The average success rate of Solana transactions before collapse was almost 80% but after the collapse, this number is decreased to 56%.
Based on the above data, both SOL and other tokens net flow during the past 3 weeks is quite negative. this means (and as it was obvious) the majority of tokens were transferred out of FTX & Alameda wallets during the past 21 days.
We can see the net outflow volume of tokens from FTX & Alameda to Solana ecosystem is 1.94 Billion USD. On the other hand, there are 6.73 net out flow SOL from the FTX / Alameda wallets to the Solana ecosystem.
During the past 3 days, the net flow of transfers from Solana to CEXs was so high (more than 2 Billion USD). This shows there are more and more money exiting from the Solana ecosystem and flowing into the Centralized Exchanges.
In terms of SOL token, we can also see negative net flow meaning that more than 17.42M USD SOL is the net flow of transfers from Solana ecosystem to Centralized Exchanges.
So, the above data are not good news for the Solana ecosystem because there are more and more money transfering out of it.
SOL, SRM and GMT Activity on Solana
According the above charts, the daily number of transactions and also users with SOL token within the Solana ecosystem after the FTX collapse has increaseg signifncalty.
The highest spike of transactions with SOL in Solana ecosystem has achieved during 17th and 18th November while the highest number of SOL users was achieved on 9th Novemer (second day after the Collapse).
Similar to the SOL token, we can also see increasing activity of SRM token within the Solana ecosystem after the collapse in both terms of number of users and transactions. We can kinda say the growth rate of SRM token’s activity is more than SOL token’s activity after the collapse timespan.
for the GMT, first of all we can see quite low activity (in terms of transactions) with this token within Solana ecosystem after the collapse (which was also low during 2 days before the collapse).
Also, we do not see a signifincat increasing activity of GMT token within Solana ecosystem after the collapse and the total trend line is almost steady before and after collapse.
Binance, OKX and Bybit suspend USDT and USDC deposits on Solana
Binance announced on Nov. 17 that deposits of Solana-based USDT and USDC have been “temporarily suspended until further notice” on the platform. The exchange referred to the tokens as “USDT (SOL)” and “USDC (SOL),” as the USDT and USDC stablecoins remain available for deposit via other blockchains. Binance did not provide more information on the measure, adding that it “reserves the right in its sole discretion to amend or change or cancel this announcement at any time and for any reasons without prior notice.” The firm subsequently resumed deposits for Solana-USDT. Other exchanges such as OKX and ByBit have also delisted Solana-based stablecoins for deposits. OKX suspended their deposits at 3:00 am UTC on Nov. 17, while ByBit reportedly disabled such deposits as of Nov. 17 as well.
According to the on-chain data, the supply of Solana-USDC is 62% bigger than the supply of Solana-USDT. The total amount of USDC circulating on Solana amounts to 5 billion USDC ($5 billion), or 11% of the token’s total market capitalization at the time of writing. The total amount of Solana-based USDT stands at 1.9 billion tokens ($1.9 billion), or just about 1.3% of USDT’s total market cap. USDC issuer Circle subsequently took to Twitter to state that USDC on Solana is operating as usual and there are no issues with issuing or redeeming the stablecoin. "USDC is always redeemable 1 for 1 for US dollars. Any amount. Any time. For Free. Always," the firm added.
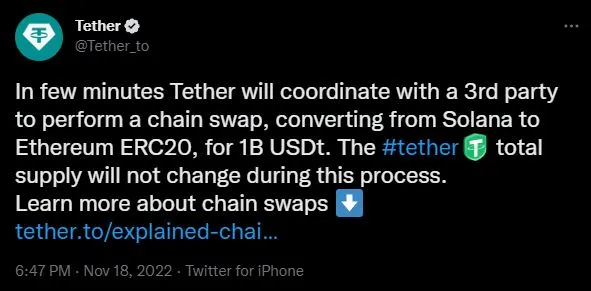
Also Tether has coordinated with a 3rd party to perform a chain swap, converting from Solana to Ethereum ERC20, for 1B USDT.
So, the above events can be impactful on the increasing number of bridges from Solana to Ethereum and especially with USDC asset.