NEAR Developers Activity
With Electric Capital’s release of its annual report on developer activity, the topic of “developers” is a hot topic across crypto. Produce a rich analysis of NEAR developer activity, using metrics and definitions of your choice to answer the questions: How many developers are active on NEAR? How active are they? How this has changed over time? Feel free to reference (and cite) the Electric Capital report to provide background, but the vast majority of your dashboard should be original work that provides a supplemental view to that report.
What is NEAR Protocol?
NEAR Protocol is a decentralized application (dApp) platform and Ethereum competitor that focuses on developer and user-friendliness. Its native NEAR token is used to pay for transaction fees and storage on the NEAR crypto platform.
NEAR Protocol is a public Proof-of-Stake (PoS) blockchain that aims to bring DeFi to the masses with low transfer fees and fast transactions.
Its consensus mechanism is Proof-of-Stake and it uses sharding technology to achieve speed and scalability. NEAR also provides a bridge and scaling solution for the Ethereum blockchain. NEAR Protocol uses PoS consensus to secure and validate transactions on the blockchain. Validators earn NEAR Token rewards for producing new blocks
Dashboard Introduction and Methodology
In this dashboard, I am going to provide a deep analysis of NEAR development and also its developers’ activity.
Actually, this dashboard provides data about NEAR’s Github development activity. Some metrics such as number of active (& total) developers on NEAR github, their actions, repositories and etc.
The main table that I am going to use for this analysis is Flipside’s near.beta.github_activity. Firstly, I want to define some of the columns in this table:
ID (Action): represents GitHub Actions which is a continuous integration and continuous delivery (CI/CD) platform that allows you to automate your build, test, and deployment pipeline. Developers can create workflows that build and test every pull request to their repository or deploy merged pull requests to production. Pull requests let developers tell others about changes they have pushed to a branch in a repository on GitHub. Once a pull request is opened, developers can discuss and review the potential changes with collaborators and add follow-up commits before their changes are merged into the base branch.
REP: A repository contains all of the developer’s project files and each file's revision history. Developers can discuss and manage their project's work within the repository.
Author (Developer): The author is the person who originally wrote the code. The committer, on the other hand, is assumed to be the person who committed the code on behalf of the original author.
Also, I am going to use Flipside’s near.core.fact_actions_events in order to analyze the contract deployment activity on NEAR with filtering the action_name column to “DeployContract”.
Moreover, I am going to use Electric Capital’s report about Developers in blockchains and especially NEAR in order to provide more details.
So, based on the above methodology, I am going to:
- Analyze Actions (IDs, Pull Requests) in NEAR Github.
- Analyze Deployed Contracts on NEAR Protocol.
- Analyze Developers’ activity in NEAR Github.
- Analyze Repositories in NEAR Github.
- I have excluded developers which were labeled as 'dependabot','dependabot-preview' on the part of dashboard that I was going to analyze developers on NEAR protocol.
There is a Date_Trunc field provided above which you can use to change the time basis of Over-Time charts to your desirable timespan (Daily, Weekly, or Monthly). The default and recommended choice is: Monthly.
There are total 2480 participated developers in NEAR protocol’s development.
The total number of repositories in its Github is 829.
The total number of deployed contracts in the NEAR protocol is 58.5k.
The 2480 developers on the NEAR protocol have created almost 52.4 pull requests and based on the left chart 45.811 of them (87.5%) are closed and there are 6553 (only 12.5%) not-closed pull requests. So, from this high share of closed requests on NEAR, we can conclude that developers are NEAR are well-performing.
On the above, you can see the minimum, median, average and maximum number of created pull requests (actions), active developers and depolyed contracts on NEAR protocol per Month.
Developers Analysis
Overall Stats
On the above, we can see the minimum, median, average and maximum number of created pull requests (actions) made by an average developer on NEAR protocol.
And on the left, can see that an average developer on NEAR protocl works on 2.18 repositories on this chain’s github.
Based on the above charts, the majority of NEAR developers (48.8% of them) have only performed one developing action (created 1 pull request) on NEAR Github and the next rank belong to the developers with 2 - 10 actions on this chain. Also, we can see more than 65.3% of NEAR developers have been active only for 1 month on NEAR protocol and also the second rank belong to the developers with only 2 months activity on this chain. The majority of NEAR developers (73.1% of them) have only worked on 1 repository.
We can also see the distribution of NEAR developers by their association (activity type) and as we see, 54.7% of them are labeled as NONE and the next rank belong to the Contributors on NEAR github.
On the above charts, we can see the average monthly activty and also the over-time activity of Developers breakdown by their association (activity type).
As we see, Contributors are the most active group among NEAR developers but their dominance is kinda decreasing over time and during the recent months, we can see positive evolution of Collaboratros on this chain but still has a long way to reach Contributors.
On the left and above charts, you can see the top NEAR developers based on their number of created pull requests, closed pull requests and also based on the number of repositories that they have worked on them.
As we see, Bowewang1996 is the most active NEAR developer while the developer Mikedotexe has worked on most number of NEAR repositories.
Repositories Analysis
On the above, you can see the minimum, maximum, average and median number of active developers and also created pull requests on NEAR repository per month.
According to the left charts, the majority of repositories on NEAR github has hosted 2-10 actions (pull requests) and the second rank belong to the repositories with 1 made action on them.
Also, 47.3% of repositores have only being worked by 2-10 NEAR developers and 42.3% of them being worked by only 1 developer. the share of repositories with more number of participated developers on them is so low.
Summary and Conclusion
According to the above analysis:
- There are total of 2480 participated developers, 829 repositories, and 58.5k deployed contracts in the NEAR protocol.
- The majority of NEAR protocol developers are part-time.
- more than 87% of created pull requests on NEAR protocol were successfully closed and the average time difference between creating & closing a pull request is 27.5 days while the median time difference is only 1 day. So, we can conclude the well-performance and high activity of NEAR developers.
- June 2022 was the highest peak of development activity on NEAR protocol but after this month (can be mainly because of the Terra collapse), there was a decline in the number of active developers, created pull requests and especially deployed contracts on NEAR protocol over time. But the total trend line of all of these metrics is positive.
- Contributors are the most active type of Developers on the NEAR protocol.
- The majority of NEAR developers have only worked on 1 repository and only created 1 pull request and were active for only 1 month.
- Bowewang1996 is the most active NEAR developer while the developer Mikedotexe has worked on most number of NEAR repositories.
- The majority of repositories on NEAR github have only hosted 1-10 pull requests (actions) and only being worked by 1-10 developers.
- NEARCORE is the most active repository on NEAR github.
- So, according to the above analysis, the most important development job on the NEAR protocol is done by a small group of active developers since there were too many developers on this chain that are not actively developing this chain.
- Totally, we can conclude that NEAR developers are well-performing and this protocol has a good health-situation in terms of development activity.
Discord: Ali3N#8546
Twitter: Alik_110
Email: Alik110.72@Gmail.com
External Source: Electric Capital Report
And on the above charts, we can clearly see that NEARCORE is the most active repository on NEAR github.
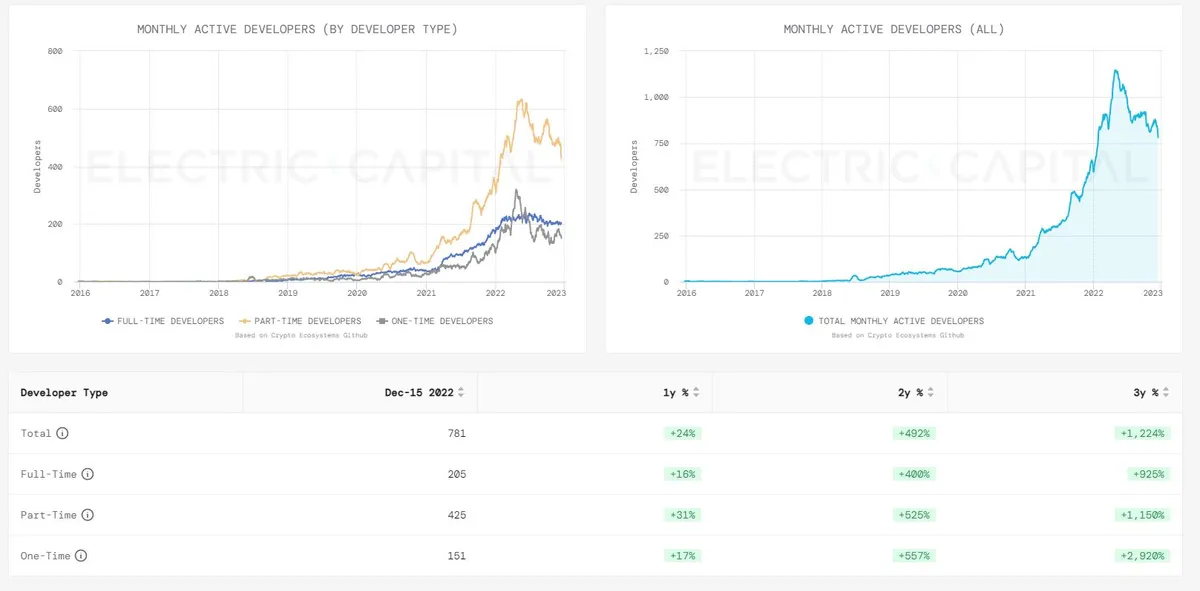
On the above data provided by Electric Capital we can see the majority of NEAR protocol developers are part-time and their growth rate is also more than other type of developers.
Also as mentioned earlier, mid-2022 were the highest peak of developers activity on NEAR chain.
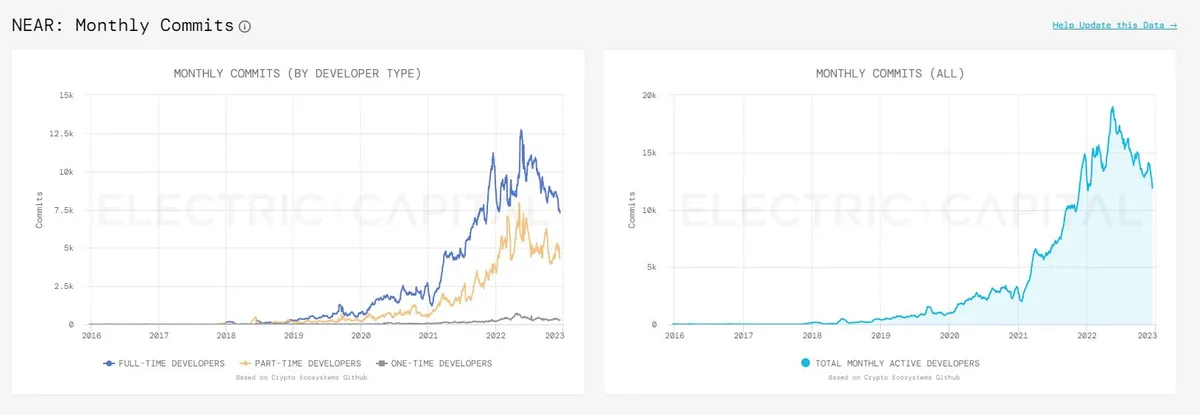
And on the above charts, we can see the evolution of commits (+ breakdown by developer type) on NEAR protocol over time and as we see, mid-2022 was the highest peak of these actions too.
The git commit command is one of the core primary functions of Git. Prior use of the git add command is required to select the changes that will be staged for the next commit. Then a git commit is used to create a snapshot of the staged changes along a timeline of a Git project’s history.
According to the above data, the average time difference between creating and closing a pull request on NEAR protocol is 27.6 days and the median time difference is 1 day which shows high activity of NEAR developers and its quite good and positive for this chain!
On the above charts, firstly we can see positive evolution of NEAR developing activity on this chain as time goes on which shows well-performance of NEAR protocol. The most number of pull requests on NEAR protocol were created on June 2022 (with total 2154 actions) and as mentioned earlier, the total trend line is clearly increasing over time. The highest number of pull requests were closed on December 2021 (1942) and again as mentioned above, the total trend line of closed pull request is increasing over time. June 2022 was the month with the highest number of active & also new first-time developers on NEAR chain and after this month, there is a decline in trend of these developers on NEAR chain which is not very good but anyway the total trend line is kinda positive. The number of active repositories on that developers are working on them on NEAR git hub is increasing over time and the most number of these repositories were being worked on during June 2022. The most number of new contracts were deployed on December 2021 and also July 2022 on NEAR protocl but after this month, we can see decline in number of deployed contracts on NEAR protocol which can not be good.