Open Analytics Bounty: ETH (November 13)
Open analytics bounties are all about deep dive dashboards into one specific topic.
Introduction
Uniswap is a cryptocurrency exchange which uses a decentralized network protocol. Uniswap is also the name of the company that initially built the Uniswap protocol. The protocol facilitates automated transactions between cryptocurrency tokens on the Ethereum blockchain through the use of smart contracts.
SushiSwap is a fork of Uniswap and a software running on Ethereum that seeks to incentivize a network of users to operate a platform where users can buy and sell crypto assets.

FTX & Alameda Collapse
During the past week, the Cryptocurrency market has experienced one of its darkest weeks in history because of the FTX & Alameda collapse that resulted in FTX's bankruptcy and the loss of millions of dollars assets and also dropping the price of almost all tokens (including Bitcoin that its price has been reduced to 15000 !).
This crash has impacted several platforms in the cryptocurrency market that We have analyzed some of them before (you can check them in my Flipside profile).
Now on this dashboard, We are going to analyse the impact of this collapse on 2 of the largest Ethereum Decentralized Exchanges, Uniswap
Methodology
For this Analysis, First I am going to split our timespan into 2 categories:
1- Before Collapse: Since 1 Month (30 Days) Ago Till Before 8th November 2022 (The date when the cryptocurrency market began to crash)
2- During and After FTX & Alameda Collapse: Since 8th November Till Today.
First, We are going to check the activity on Uniswap with mainly using ethereum.uniswapv3.ez_swaps and then we are going to check the Sushiswap activity using ethereum.sushi.ez_swaps. These DEXs are available on several chains but since their main activity is on Ethereum and in addition, this is an Open Analytic Ethereum bounty (!) we are going to analyse their activity on Ethereum and you can expand the results for other chains too.
Also, I am going to calculate the average daily values for the 2 mentioned timespans in order to get more clear results for comparing data on these timespans.
Based on the above charts, the activity of swaps on Uniswap has increased dramatically during FTX & Alameda collapse especially in volume.
As we see on the average charts, the volume of swaps after and during the collapse is almost 2x more than days and weeks before this timespan.
The highest spike of swaps on Uniswap has achieved on 9th November with 164.12M USD worth of swaps which is way higher than the highest spike before the collapse which was only 71M USD !
Also according to the left charts, we can see the share and number of swaps with more than $1000 volume has increased significantly during collapse timespan.
And on the left charts, we can see te average number and volume of swaps FROM stablecoins have increased significantly during and after collapse timespan.
Also, on the other hand, we can see increasing number and volume of swaps TO stablecoins.
So, Totally, stablecoins have experienced massive growth in their swap during the FTX & Alameda collapse and the share of swaps with other tokens (non stablecoins) during collapse timespan was less than days and weeks before that.
On the left chart, we can see increasing share of swaps on stablecoin pools during the collapse timespan.
But in terms of volume we can see several increasing and decreasing high and low spike of both swap pools.
For example, we can see stablecoins swaps on 9th November has a significant share of 95% of total swaps but suddenly on 11th November, we can see the share of nonstablecoin swaps is 92% !
On the left charts, we can see increasing share of swaps on stablecoin pools during and after FTX & alameda collapse comparing to the days before it.
On the other hand, the share of non stablecoin swaps has decreased.
On the left chart, we can see top 10 assets of each day to swap FROM them, during past month till today incluing the FTX & Alameda collapse.
We can see increasing share of swaps from some assets such as WBTC, and 1inch tokens and on the other hand, decreasing share of swaps from some assets such as DAI.
On the left chart, we can see top 10 assets of each day to swap TO them, during past month till today incluing the FTX & Alameda collapse.
we can see USDC, USDT and WETH have the lead in all days and these tokens has experienced significant volatile in their swaps count and volume during collapse.
Moreover, we can see increasing share of swaps to some assest such as DAI during the collapse.
And on the left chart, we can see top 10 swap pair of each day in terms of volume and number of swaps.
As we see, the majority of swaps belong to the WETH/USDC and WETH/USDT pools and there are increasing volatile on them during the collapse timespan.
Moreover, we can see some increasing activity of pools such as USDC/USDT and also UNI/WETH during the collapse timespan.
And on the left chart, we can see the average tokens’ balance of Uniswap pools has decreased significantly during the collapse timespan and this is because maybe traders have lost their trust in crypto protocols even a decentralized exchange like Uniswap !
Similar to the uniswap, we can also see quite increasing activity (especially in volume) of swaps on Sushiswap during and after FTX and Alameda collapse.
We can see the difference between average daily volume of swaps during collapse timespan and days and weeks before that is way higher than Uniswap’s difference. On Sushiswap, we can see there is almost 2x more generated volume of swaps during the collapse compared to the days before that.
Similar to the uniswap, we can see increasing share of high-volume swaps (with more than $1000 volume) on Sushiswap as time goes on especially during the collapse timespan.
Similar to the Uniswap, There was increasing activity of swaps FROM stablecoins especially in terms of volume from 8th November till 12th November. But suddenly on 12th November, There was quite an increasing share of swaps TO stablecoins. So, we can conclude that users were swapping their stablecoins into other assets which have experienced massive drop in their price in order to buy them at the dip, but then on 12th November and when the assets’ price has almost recovered, traders again swapped their assets to the stablecoins.
Also on the left charts, we can see increasing share of swaps TO and also FROM stablecoins during the collapse timespan comparing to the days and weeks before that and on the other hand, the share of non-stablecoin swaps on these days have decreased significantly compared to the before days and weeks.
Also on the left chart, we can see increasing share of swaps on Stablecoin pools during the first days of collapse (8 - 11th November) but after a while on 12th November, we can again see increasing activity of nonstablecoin pools.
As mentioned above , the increasing share of Stablecoin pools swaps during and after collapse timespan is clearly visible on the left charts.
On the left chart, we can see top 10 assets of each day to swap FROM them, during past month till today incluing the FTX & Alameda collapse.
we can see increasing volatile during collapse timespan (since 8th November) with increasing share of swaps from some assets such as AAVE and also SUSHI !
On the other hand, On the left chart, we can see top 10 assets of each day to swap TO them, during past month till today incluing the FTX & Alameda collapse.
we can see increasing share of swaps to FTT token in some days despite its massive price drop ! this means Sushiswap users are gaining profit from FTT’s volatile !
and on the left chart, we can see increasing volatile during the FTX & Alameda collapse.
Similar to the Uniswap, the average daily balance of Sushiswap pools have also decreaseg significanlty after the collapse.
Summary and Conclusion
- There was dramatical increasing swap activity on both Uniswap and Sushiswap during and after FTX & Alameda Collapse especially in volume.
- The share of high-volume transactions (more than 1000 USD) has also increased significantly during the collapse timespan.
- on both platforms, There was increasing activity of swaps FROM stablecoins especially in terms of volume since 8th November till 12th November. But suddenly on 12th November, There was quite increasing share of swaps TO stablecoins. So, we can conclude that users were swapping their stablecoins into other assets which have experienced massive drop in their price in order to buy them at the dip, but then on 12th November and when the assets’ price has almost recovered, traders again swapped their assets to the stablecoins. This similarity between both platform's traders is interesting !
- Totally, stablecoins have experienced massive growth in their swaps (especially on Uniswap) during the FTX & Alameda collapse and the share of swaps with other tokens (non stablecoins) during collapse timespan was less than days and weeks before that.
- The average pools balance of both Uniswap and Sushiswap has decreased significantly during the collapse timespan and this can be because users lost their trust and also hope from the cryptocurrency platforms even decentralized exchanges!
- The impact of FTX & Alameda collapse on Sushiswap's volume (almost 2.5x more than previous days) was more than Uniswap (almost 2x more than previous days).
Discord: Ali3N#8546 Twitter: Alik_110 Tweet Link For This Dashboard:
On the above charts, we can see increasing activity of swaps FROM stablecoins especially in terms of volume since 9th November till 12th November. But suddenly on 12th November, we can see quite increasing share of swaps TO stablecoins.
So, we can conclude that users were swapping their stablecoins into other assets which have experienced massive drop in their price in order to buy them at the dip, but then on 12th November and when the assets’ price has almost recovered, traders again swapped their assets to the stablecoins.
On the left chart, we can see quite decreasing price of both UNI and SUSHI tokens since 8th November but on since 12th November, there is almost increasing trend of their price.
The reason behind this price growth can be because users have lost their trust in CEXs and their tokens and on the other hand, they are migrating to the Decentralized exchanges and buying their native tokens (including UNI and SUSHI)
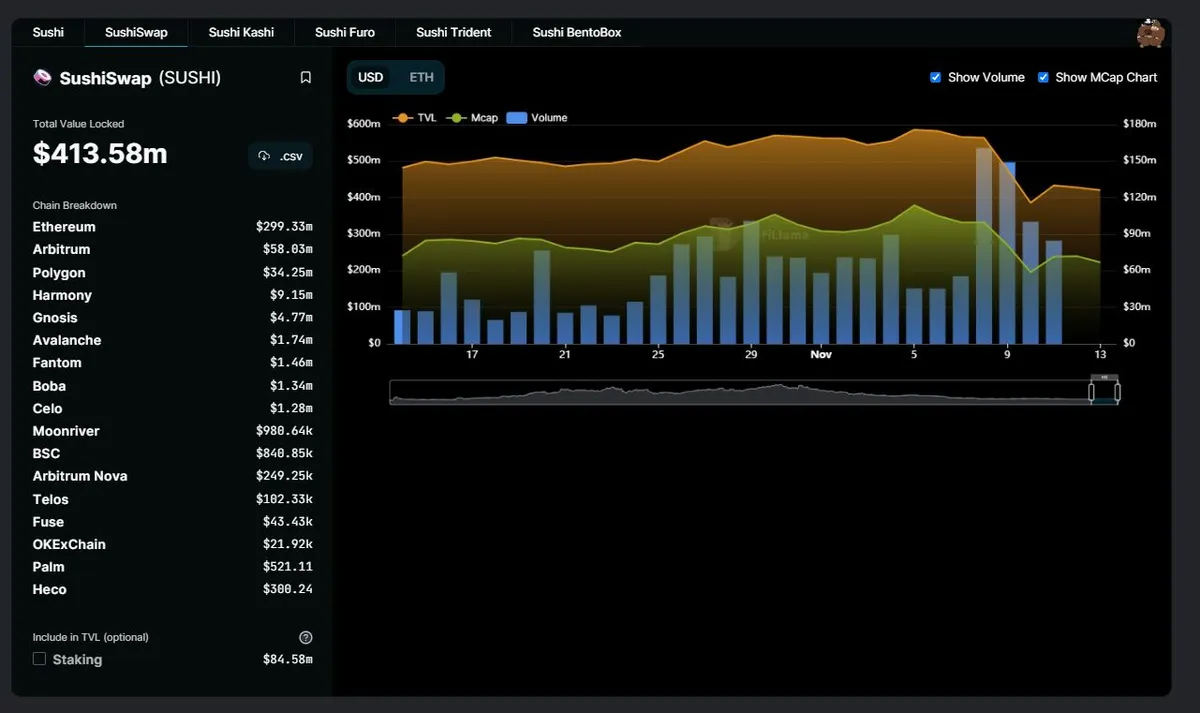
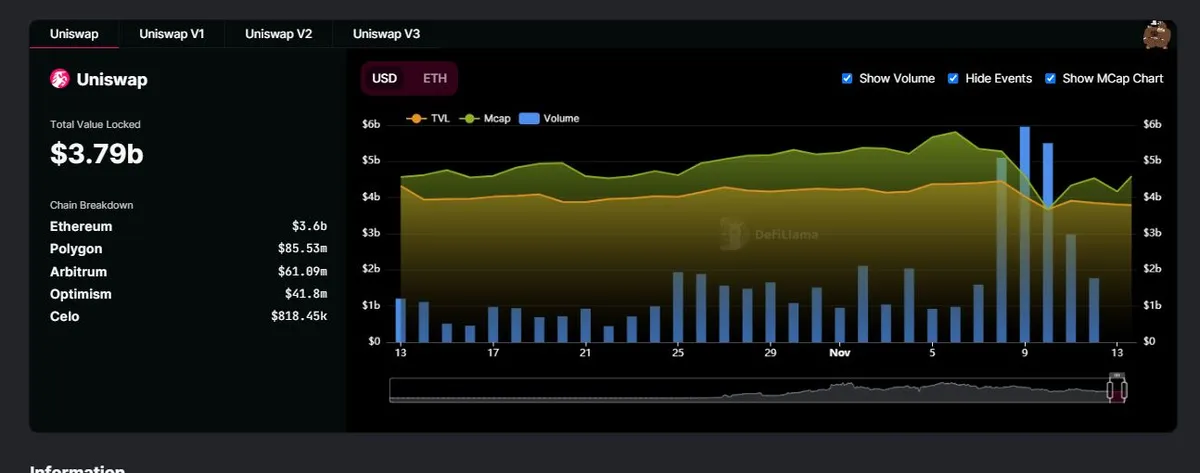
On the above charts from the Deflllama, we can see the swap volume on both Uniswap and Sushiswap have increased significantly during the collapse timespan (as mentioned on the above analysis) but on the other hand, the total market cap and also TVL of these platforms has experienced significant decrease.