Optimistic Bears
Q9. Analyze Optimism during the month of July as markets were get turbulent, showing whatever metrics you care to unearth. You can choose any topic you’d like: How did the network perform? What about market performance? Were there significant inflows or outflows on bridges? Were there any notable patterns in user behavior?
What is Optimism ?
Optimism is a layer-two blockchain for Ethereum using optimistic rollups as scaling technology and one of Ethereum’s biggest scaling solutions. Optimistic rollups outsource the execution of transactions to a L2 solution like Optimism. The transactions on Optimism are rolled up into batches that get relayed to the Ethereum mainnet, which only records the new chain state. Since their validity is assumed, the rollups are called optimistic. A rollup's validity can be challenged for up to seven days, which is why withdrawals from Optimism to Ethereum take seven days.
Optimism Recent Rally
OP, the native token of Optimism, the Layer-2 scaling solution, leads with a 94.92% spike in price in the recent days. Apart from the price rally, the protocol also saw significant ecosystem updates during this time For example, the L2 protocol launched its new Optimism onboarding flow for new and experienced cryptocurrency traders. Also, it launched its first Euro pegged stablecoin in the form of $agEUR.

In this bounty, We are going to analyze the Optimism network during July 2022 and compare it to the market situation.
In my opinion, We can analyze the cryptocurrency market situation by analyzing its top cryptocurrencies (BTC and ETH).
Whenever the BTC price fell off, we obviously see a similar decrease in cryptocurrency market cap and also Altcoins prices. Because the cryptocurrency market is highly correlated with bitcoin is to say that it doesn’t move up (or down) without BTC moving up (or down) as well. This is what correlation means: when one correlated variable moves, the other correlated variable moves with it.
But, in addition to BTC price, other on-chain data and also and stock prices are somewhat correlated together. Many of the factors that affect stock prices also affect cryptocurrency prices. Investors and traders treat cryptocurrency the same way they treat stocks, so prices tend to trend the same.
Moreover, I am going to check some “Health” related factors for Optimism network during this time.
Based on the below charts which are showing BTC and ETH price (Market situation in my opinion) during July 2022 w.e can define the bearish time of markets (when the market get turbulent).
So, we can see two huge crash rallies during the month of July. The first one is Between 8th - 13th July and the second bearish time is 20th - 26th July.
So, I am going to refer to these 2 timespans in my descriptions to analyze the Optimism network during the month of July, especially during these 2 bearish timespans.
On the above chart, we can see there were total 3437525 Unique Transactions made in July.
This number of transactions were made by 194706 Unique Users.
The total generated fee by these transactions and users is 10.17 OP (9.03 USD)
On the left chart, we can see Maximum and also average TPS of Optimism network during month July.
As we see, the maximum number of TPS have achieved on13th July (on the last date of first bearish period) with 409 TPS made.
Moreover, we can see another high spike on 27th July (when the market was about to recover its price after second bearish period).
Moreover, totally, we can clearly see an increasing trend of Optimism Average TPS over time during July espeially during recent days of this month when the OP rally was going on (as mentioned on the start of the bounty)t
On the left chart, we can see distribution of failed and successfull transactions during the July month for Optimism.
As we see more than 90% of all performed transactions were successfull which is a satisfying results and only less than 10% of transactions have lead to fail.
On the above charts, we can clearly see the price correlation between OP and ETH, BTC over time during July.
We can see OP correlation with ETH is way more than its correlation with BTC.
Moreover, the interesting this is that OP is well-controlling its price during the market bearish periods because we dont see a huge price crash during these 2 timespans. Also, during the second bearish period we can even see the increasing price of OP token over time despite the market situtation which is amazing!
And on the last days of July, we can see as the BTC and ETH prices growing, the OP token price is also growing more and more and this shows the correlation between OP vs ETH and BTC especially with the ETH token which having the most similar trend movements to each other.
On the left chart, we can see daily number of transactions during July for Optimism.
As we see, the total postivie trend is clearly visible on the chart especially during the last days of July.
Moreover, we can see there are by far more Successfull transactions than Failed ones in all days, the fail and success rate of transactions have a correlation with the number of transactions.
Also, during the bearish periods, we can see almost a constant number of transactions and also constant rate of successfull and failed transactions on the chart which is satisfying and shows us how Optimism is manaing the network performance during these bearish timespans.
On the left and above charts, we can see the correlation between number of Optimism transactions vs OP and BTC and ETH price over time during July.
We can see theere is quiet a positive correlation between these metrics. As the number of Transactions growing up, the tokens price also growing more and more.
Obviously, the most correlation for Optimism transactions count is with OP price.
the correlation between Optimism transactions count and BTC and ETH price is almost equal to eachother.
During bearish periods, we can also see the constant number of transactions on Optimism and this shows that its users do not care much about market situation when performing transactions on Optimism.
On the left chart, we can see number of unique users that are performing transactions during July.
As we see, there is almost a constant number of users over time which have increased significanlty after 27th July.
during the bearish periods, we can see almost a very light negative trend in number of users interacting with Optimism transactions.
But, immediately after the stabiltiy or growth of market, we can see the high spikes on number of Optimism users.
On the left chart, we can see total daily generetade fee (in OP and USD) over time in July.
As we see, the most number of Fees were generated during the last days of July, the same time when OP price was growing more and more.
Also, We can see the overtake of USD fee from OP fee during these last days that shows that OP price is growing more and more over these days.
during bearish periods, we can see a constant well-controlled generated fee for Optimism.
And on the left chart, we can see the cumulative number of transactions on Optimism during July month based on their status (failed or succesfull).
As we see, the increasing trend of these trend lines during recent days of July is clearly visible on the chart.
NFT
Now, we are going to analyze total stats of NFT sales on Optimism.
Btw, the only platform that the Optimism NFT sales table is supporting on Flipside is currently Quixotic (which is the top NFT marketplace on Optimism), So, the data below mostly shows the analyze for this marketplace and we can expand it to the whole NFT ecosystem of Optimism.
Based on the above data, the total number of NFT sale transactions on Optimism during July is 14291 Unique TXs. This number of sale transactions have generated more than 289494.6 USD Volume.
The total number of NFT buyers on Optimism during July is 4580 and number of sellers is 4840 unique wallets.
Moreover, there were total 104 NFT collections (including 10.01 tokens) that were traded during July on Optimism.
On the above chart, we can see the number and volume of NFT sales and also correlation between OP price and number and volume of NFT sales on Optimism during July.
We can see the increasing trend of NFT sales during July month especially after 26th July which the sharpest trend of increasing OP price and also number of NFT sales have achieved during this time.
Moreover, we can see there is almost a similar correlation between OP price and NFT sales on Optimism over time and it is clearly visible during the last days of July.
Also, we can see the impact of the first bearish market period, but for the second one, we can not see any impact on NFT sale volume.
On the left chart, we can see the growth rate of volumes and number of NFT sales transactions on Optimism.
As we see, the increasing slope trend is clearly visible after 26th July.
Also, the growth rate of number of sales is growing faster that their volume.
On the left chart, we can see the number of NFT sellers and buyers on Optismism during July.
We can see the total incrfeasing trend of these numbers especially after 27th July ( the same time when we had the increasing number of sales).
Moreover, during bearish periods, we can barely see a decreasing number of sellers and buyers on Optimism which means the NFT traders on Optimims dont care very much about market situations
As we see, the total TVL of Optimism native bridge is increasing well over time.
Also, during the first market baerish period, we can see also the decreasing trend of TVL on Optimism bridge, but on the second bearish period, we can not only any negative impact, but also the TVL of Optimism bridge is growing more and more.
On the above charts, as it is obvious, we can see the most volume and number of bridges and bridgers, have bridged their asset from L1 to L2 via Optimism native bridge.
This number is even more in terms of bridge volumes which we can see a very low volume of bridges from L2 to L1 (almost 0%)
Now on the above charts, we can see the number of ETH bridgers and also bridge transactions during July based on their type (from L2 to L1 or L1 to L2)
As it was obvious, the most number of bridges were made from L1 to L2.
Also, we can see a significant increase on these numbers during last days of July after 27th.
Moreover, we can see a very light impact of first market bearish period on number of bridges but there is not a negative impact of second bearish period on the number of bridges and bridgers for Optimism.
In terms of volume, we can see the volume of L1 to L2 transactions in most of the days are more than L2 to L1 bridges.
Moreover, we can obviously see the impact of first market bearish period on volume of bridges but during the second bearish market period this impact is quite lower than the first one to the extent that in some days we can even see the increasing trend of bridge volumes.
Same as previous charts, we can see the huge increasing volume of bridge transactions via Optimism native bridges during the last days of July.
Based on above definiation, we can see there were total 1544874 Unique Swap Transactions during July that were made by 46801 Unique Wallets.
On the above charts, we can see the correlation between number of swaps and also swappers on Optimism and OP token price. as we see, there is quite a direct relation between these 2.
The number of swaps and swappers have increased dramatically during the last days of July (the same time when OP ecosystem has growth well according to the previous charts).
Moreover, there is not a negative impact of bearish market period on number Optimism swaps and swappers.
On the left chart, we can see the number of swap transactions on top Optimism DEXs during July.
We can see the highest number of swaps were made on Uniswap as the leading Optimism DEX.
After that, we can see Rubicon on the second rank.
Morover, we can see the significant increase of swap transactions during last days of July.
Also, the negative impact of first bearish market period is visible on number of swaps on these DEXs. but the second period did not make a negative impact on these numbers.
on the left, we can see the growth rate of number of swap transactions on these 4 top DEXs which we can see Uniswap is leading all the way by far.
the impact of increasing number of swaps during the last days of July is clearly visible on the slope of trend lines on the chart.
And on the left chart, we can see that USDC and ETH are the most popular assets to bridge via Optimism native bridge during july and after them we can see WBTC and USDT on the next ranks.
Now, I am going to analyse ETH bridges via Optimism native bridge (as one of the most popular token that can be bridged) and check the situation of this token bridge during July.
And on the 2 above charts, we can see the Top 5 Popular swap pools on Optimism DEXs during July based on the number of swaps and also swappers.
As we see, OP/USDC and USDC/WETH were the top popular Pairs on Optimism DEXs during July
Conclusion:
Based on the above analysis we have realized that Optimism network ability to maintain itself during the bearish periods of total market is massively incredible.
-
there were total 3437525 Unique Transactions made in July.
-
This number of transactions were made by 194706 Unique Users.
-
The total generated fee by these transactions and users is 10.17 OP (9.03 USD)
-
More than 90% of all performed transactions were successful which is a satisfying result and only less than 10% of transactions have result in fail.
-
The maximum number of TPS have achieved on13th July (on the last date of first bearish period) with 409 TPS.
-
OP token price correlation with ETH is way more than its correlation with BTC.
-
There is positive correlation between Optimism growth (especially its native token OP) and number of NFT sales and also swaps during July.
-
The impact of first bearish market period (8 to 13 July) was more than the impact of the second period (20 to 23 July) to the extent that we could barely see any impact of the second period on the Optimism growth. Thats why I have mentioned the perfect-controlling ability of this ecosystem during the bearish market periods.
==Discord: Ali3N#8546==
Some Extra Information About Optimism:
With the upcoming release of Ethereum 2.0, investors are depositing an extremely large number of ETH to the Optimism smart contract with deposits spiking to 40,000 coins, which is an unseen number of coins deposited to Optimism in the last 90 days.
Besides the enormous spike in deposits, Optimism saw a spike in trading volume, which is a strong fundamental sign that might show that the current rally of OP token is filled with speculative trades and we might see a rapid drop in volume after the Ethereum update rolls out.
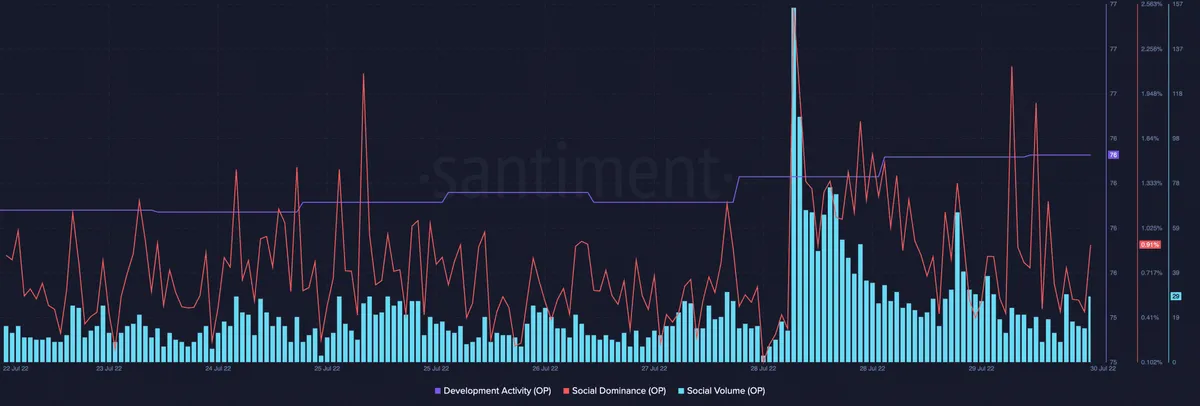
In the period under review, data from Santiment revealed that the token’s social dominance peaked on 28 July when the metric touched a high of 1.03%. This was, however, followed by a 32% decline causing the token’s social dominance to be pegged at 0.77% at press time. On a seven-day window, the token’s social dominance grew by 17%
OP’s social volume also touched a high of 1065 on 28 July. At 195 at press time, the metric registered an 81% decline within two days. On a seven-day window, this metric saw a 43% growth. Within the same period, the token’s developmental activity logged a minor growth of 0.37%.
Moreover, the protocol also saw significant ecosystem updates during recent weeks. For example, the L2 protocol launched its new Optimism onboarding flow for new and experienced cryptocurrency traders. Also, it launched its first Euro pegged stablecoin in the form of $agEUR.
On the left chart, we can see different type of users daily activity during July on Optimism.
As we see, there is an exact correlation between First-time and unique users on Optimism.
Moreover, we can see the increasing number of users in the recent days of July and its mainly because of Optimism ecosystem growth (or can be the reason behind that growh!)