$OSMO Abnormal Price Movement on Dec. 2022 and Its Impact on Osmosis Chain
What happened to $OSMO token and what was the impact of this abnormal activity on the Osmosis chain.
What is Osmosis?
Osmosis is a DEX protocol built on Cosmos, which means it uses smart contracts to determine the price of digital assets, to produce liquidity via a peer-to-peer (P2P) methodology, and to exact trades between users. This approach to an exchange platform is known as an AMM — a DEX protocol that prices crypto assets in liquidity pools.
$OSMO is the native token of the Osmosis network. Primarily, OSMO is used for staking to secure the Osmosis chain. As a PoS token, OSMO is inflationary. Over time, new tokens will be minted and entered into circulation. The maximum number of OSMO tokens has been set at 1 billion.
Binance to List Osmosis ($OSMO)
in October 2022, Binance announced that it will list Osmosis ($OSMO) in the Innovation Zone, a dedicated trading zone for new, innovative tokens that might be more susceptible to volatility than larger, established crypto assets. Binance also announced that it will open trading for OSMO/BTC, OSMO/BUSD and OSMO/USDT spot trading pairs at 10:00 UTC on October 28th. Users could start depositing $OSMO earlier. Withdrawals for $OSMO will open at 10:00 UTC on October 29th.
Following the announcement, the price of Osmosis increased from $1.313 to $1.684 in a matter of roughly 30 minutes.
Check out my analysis of Binance listing impact on Osmosis in this link:

$OSMO Abnormal Price Movement
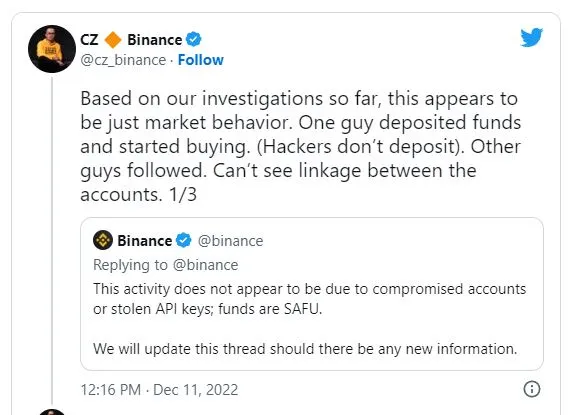
On Dec. 10, Binance issued a notice about abnormal price movements for some trading pairs including $OSMO token. The exchange began an investigation to narrow down suspicious accounts responsible for the issue. To investors’ relief, Binance’s investigation did not point to the possibility of compromised accounts or stolen API keys.
However, the exchange took a proactive measure against possible manipulation. It temporarily blocked withdrawals for some accounts that made profits during the volatility, which according to CZ, sprouted complaints across social media.
CZ further addressed the concerns related to centralization and company intervention during similar occasions as he stated, “There is a balance to how much we should intervene.”
When asked about the possibility of using stolen or compromised accounts for carrying out manipulative trades, CZ clarified that Binance actively monitors such accounts, adding that:
> “If you leave your account details with a 3rd party platform that gets hacked, and the hacker is cautious in using it, it can be hard to detect on our side. But we try.”
Rumors About This Unusual Activity
Like the previous times, it has been reported that some currency pairs were bought and sold in the Binance exchange without the permission of the users. In fact, in this fraud method, hackers buy and sell some currencies with low market cap by having the API key of the users. As a result of this work, these currencies are pumped and dumped, and hackers profit from artificial supply and demand.
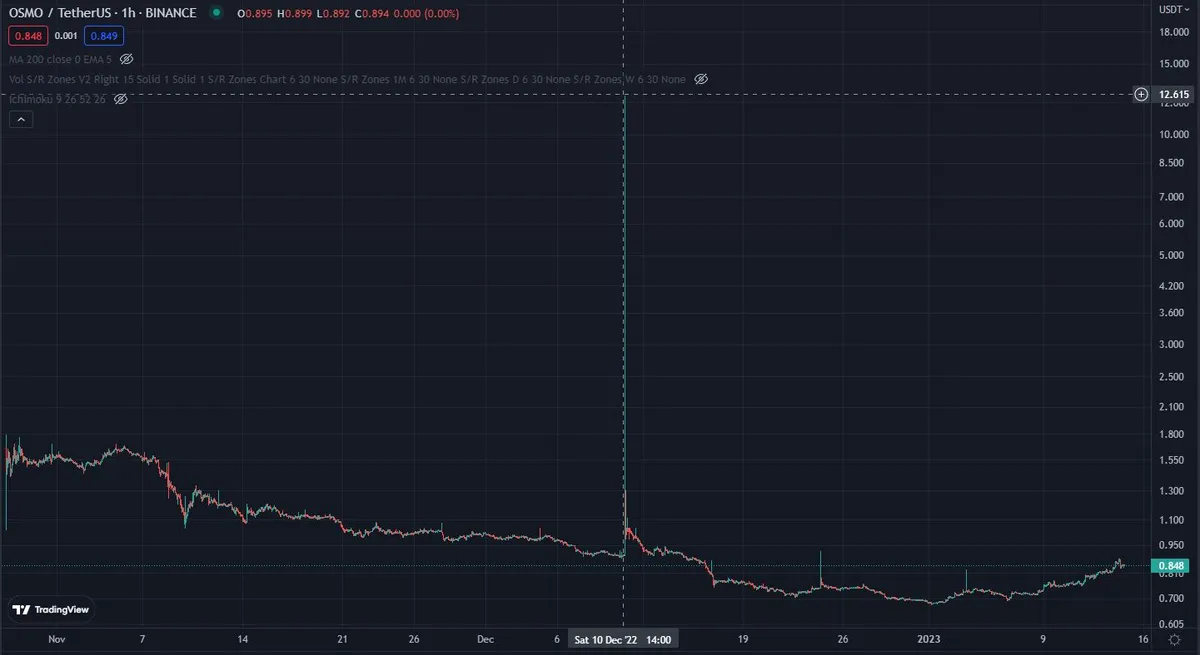
This destructive action has been reported for many altcoins, including OM, AMP, NEXO, LOOM and $OSMO. The leak of these API keys has once again been attributed to the trading bot platform 3Commas. As a result of this attack, as an example, based on the data from Tradingview (right chart), $OSMO has experienced a massive raise in its value for a while and then returned to its previous price level within a few minutes.
However, Binance has totally denied this rumor about hack activity and said:
> This activity does not appear to be due to compromised accounts or stolen API keys; funds are SAFU.
Dashboard Introduction & Methodology
On the occasion of this unusual $OSMO price movement on December 10, I am going to analyze the activity over Osmosis chain and also $OSMO token from 1 week before this abnormal activity till 1 week after. So, this analysis time frame is from December 3 to December 17.
I have defined 3 timespans for this analysis:
1- Previous Days: The Days Before 10th December (Unusual Activity Day) | 2022-12-03 ~ 2022-12-10
2- 10th December: The Main Unusual Activity Day | 2022-12-10
3- Next Days: The Days After 10th December | 2022-12-10 ~ 2022-12-17
So, In the 3 above timespans, I am going to:
-
Analyze The overall Activity in the Osmosis chain such as network transactions, active & new users and also generated fees from transactions over the mentioned time period. (using osmosis. core.fact_transactions table)
-
Analyze the $OSMO transfer activity within Osmosis and also its transfers to/from Binance Exchange and also identify the wallets who have caused the high-volume transfers to this exchange. (using osmosis.core.fact_transfers table)
- Since there are not any labeled ‘cex’ wallet addresses in dim_labels table and also crosschain tables for Osmosis, I got some help from my previous analysis that was done on the occasion of $OSMO listing in Binance, in That analysis, I have extracted and identified the Binance exchange wallet addresses (osmo129uhlqcsvmehxgzcsdxksnsyz94dvea907e575 & osmo1krmqr8zhvteevq4hnl7q0pxtff6xpnqz4ckxcu)
-
Analyze the overall swap activity in the Osmosis chain and also $OSMO token swap activity. (using osmosis.core.fact_swaps table)
-
Analyze the overall liquidity-providing actions in the Osmosis chain over this time period. (using osmosis.core.fact_liquidity_provider_actions table)
-
Analyze the staking/unstaking actions in Osmosis via $OSMO in this time period. (using osmosis.core.fact_staking table)
-
Analyze the $OSMO balance of Osmosis wallets in this time period. (using osmosis.core.fact_daily_balances table)
In all the above parts, I am going to first analyze the activity in Hourly over-time charts then calculate the average hourly activity in the 3 mentioned timespans.
The tables that I have used for this analysis are the majority of Flipside’s osmosis.core tables including the newly released price table (osmosis.core.ez_prices) in order to calculate the USD value of actions.
Osmosis Transactions and Users Overview
According to the above charts, the number of transactions and active and also new users in Osmosis has increased sharply on December 10. The total generated fee on this day is also kinda high. So, that abnormal $OSMO price movement made Osmosis users to perform activities in this chain. Moreover, during the next days, we can see kinda high increasing activity on Osmosis especially in terms of executed transactions on chain over time. But, we can see the average transactions fees on 10th Decemer is not so high and this means that users have not done many high-cost transactions in Osmosis on December 10th and maybe the majority of their transactions was transfer-related.
On the average bar charts, we can obviously see that the average hourly number of transactions and also active and new users in Osmosis on 10th December is way more than 2 other timespans. As mentioned above, there are also higher number of transactions during the days after 10th December compared to the previous days but the number of active and new users during previous days was more than next days.
And on the last chart, we can see the similarity between $OSMO price and number of Osmosis transactions on 10th December.
Totally, despite these high increasing activity that we have seen, they can not be the main reason behind that abnormal $OSMO movement since the difference between 10th December high spikes and other days high spikes is not so high.
$OSMO Transfer Activity
According to the above data, the $OSMO transfer activity during 10th December is way high and with a big difference from other days. both number and volume of $OSMO transfers on this day has increased sharply but the average volume of transfers on this day was not so high (11th December transfers have higher average volume). The interesting result based on average bar charts and also normalized %wise charts is that the share of transfers within Osmosis chain on 10th December has increased significantly. during the previous and next days of 10th December, there were way higher $OSMO IBC_TRANSFER_IN transfers (inflow of $OSMO to the Osmosis chain) but on 10th December, we can obviously see the high dominance of OSMOSIS transfers ($OSMO flow within OSMOSIS chain). So, we can conclude that abnormal $OSMO price movement has caused users to move/transfers their $OSMO tokens within the chain and between wallets and maybe to the centralized exchanges in order to sell them and take profit.
$OSMO Transfers To/From/In Binance Exchange
As mentioned, I have extracted 2 walled addresses that belong to the Binance exchange: osmo129uhlqcsvmehxgzcsdxksnsyz94dvea907e575 & osmo1krmqr8zhvteevq4hnl7q0pxtff6xpnqz4ckxcu
When the receiver address is one of the 2 wallets and the sender address is none of them, This means there is INFLOW To Binance.
When the sender address is one of the 2 wallets and the receiver address is none of them, this means there is OUTFLOW from Binance.
When both sender and receiver addresses are Binance wallets, This means OSMO is being transferred inner the Binance exchange.
We can say with confidence that most unusual activity of $OSMO token on 10th December has occurred in Binance exchange. On the above charts we can see some huge high spikes of $OSMO transfers from/to/in Binance exchange on 10th December and especially Inflow and Inner Binance transfers. So, this is kinda a proof to the CZ tweet that we have mentioned earlier. Seems there are some unusual $OSMO deposit activity to the Binance exchange on this day and we can say the main reason behind this high inflow to Binance is because users were trying to sell their $OSMO tokens in order to take profit from that massive high spike in its price that did not last so much! In the average hourly charts, we can obviously see the higher volume and number of $OSMO transfers to/from/in Binance exchange on 10th December compared to the other days. In same day, we can also see the high increasing share of Inflow to and also Inner Binance exchange transfers while on other (previous and next) days, we can see the share of Outflow $OSMOs from Binance is more than both Inflows and Inner transfers.
Osmosis Swap Activity
According to the above charts, abnormal $OSMO price movement has also caused volatiles in swap activity within Osmosis chains. We can see there are high increasing number and also volume of swaps within Osmosis chain during the 10th December to the extent that the average houlry number and volume of swaps and also active swappers on this day is way more than other days. This unusual activity can be mainly because users were trying to exchange their $OSMO because of that high volatile.
$OSMO Swaps Activity
Now and based on the above charts, we can say that the main reason behind the high swap activity on Osmosis is because of the $OSMO token. on 10th December, there are high huge spikes of both volume and number of swaps especially TO $OSMO token which means users were trying to buy more and more $OSMO token maybe in order to take profit from its massive raise in price.
According to the left chart, in majority of days, the sell pressure (swaping from) of $OSMO token is more than buy pressure (swapping to) but on 10th December, we can see an high spikes of swaps to the $OSMO token which means the high buy pressure of this token on this day.
On the above chart and as it was obvious, the volume and number of $OSMO swaps has increased significantly on 10th December.
Also as mentioned earlier, on the right chart, we can obviously see that the share of Swaps To $OSMO token on 10th December has increased significantly while on other days, there are way more volume of swaps from $OSMO (selling this token)
Liquidity Providing (LP) Actions in Osmosis
According to the above charts, we can say Liquidity Providing Actions were the least affected actions in Osmosis because of its price movements to the extent that number of LP actions on 10th December is less than previous and next days.
But in terms of volume, we can see more LP actions volume on 10th December compared to the other previous and next days. Also, the share of removing liuiqidty actions (pool_exited) on 10th December has increased signifncalty and the main reason behind this high removal activity can be because users were trying to remove their $OSMO from liquidity pool and maybe sell it or exchange it in order to take more instant profit!
Osmosis Staking Actions
$OSMO Balance of Osmosis Wallets
On the left chart, we do not see an impressive movement of $OSMO balance of Osmosis wallets during that time period.
But with a closer look, we can see that the $OSMO balance of Osmosis wallets during 10th December is slightly more than their $OSMO balance in other days.
Summary and Conclusion
Based on the above analysis:
- The overall activity on the Osmosis chain has increased significantly on the main day of the unusual $OSMO price movement and also is increasing slightly as time goes on.
- There were are also high increasing number of active and new first-time users on Osmosis on 10th December.
- The main impact of that unusual price movement was on $OSMO transfers within the OSMOSIS chain and especially to/from the Binance exchange.
- The majority of $OSMO transfers on 10th December were done within OSMOSIS Chain while on other days, IBC_TRANSFER_IN transfers had the highest share in $OSMO transfers.
- As CZ and community said, there were some high unusual activity of $OSMO transfers to/from/in Binance exchange on 10th December and especially we have seen high increasing share of Inflows to the Binance exchange and the main reason behind this activity can be because users were trying to sell their $OSMO in order to take their profit from that unusual short-term price movement.
- The buy-pressure of (swapping to) $OSMO token has increased significantly on 10th December while on other previous and next days, we have seen way higher sell-pressure of this token. 10th December was the only day with higher buy-pressure than sell-pressure.
- The volume of liquidity providing actions especially exiting_pools has increased significantly on 10th December and the main reason can be because users were trying to remove their $OSMO from liquidity pools in order to take instant profit by selling/exchanging it.
- The volume of $OSMO staking actions on 10th December has increased significantly and on the other days, we have seen decreasing number and volume of redelegations and undelegation actions on this day.
- So, we can not 100% say that abnormal activity was because of the hack or api-attack activity but at least we have realized that the main reason was the activity on Binance exchange that caused also high activity on Osmosis chain and thi was good for Osmosis project !
Discord: Ali3N#8546 Twitter: Alik_110 Email: Alik110.72@Gmail.com
On the left chart, I have tried to identify the main $OSMO depositor wallets TO the Binance exchange on each day. (I have excluded the 2 Binance wallet addresses from the results)
We can see high-volume deposit by the wallet address osmo1gren0yydnxapxhx86gzlwalkq29kzy880er08m to the Binance exchange on 10th December and there is not any trace of him/her on other days. This wallet has deposited more than 1.60M OSMO into Binance.
We can also see high volume of deposits by the wallet address osmo1tqctx98qz2aa25j5knzuztxaerl3z0ld8q6c72 on 10th December.
On the other hand on the left chart, I have tried to identify the main $OSMO withdrawer wallets FROM the Binance exchange on each day. (I have excluded the 2 Binance wallet addresses from the results)
The wallet address osmo16tz3zjch9xpxkkh07758p0kpy2eag4vh0ll8v5 is the main $OSMO withdrawer from the Binance exchange in majority of days (including December 10).
osmo1q272app7f5j5zgpjcewdajljurgansg6wqj7ke has also withdrawn the second highest $OSMO from Binance exchange on these days.
Similar to the Liquidity Providing actions, Staking actions in Osmosis were not also high-affected by the $OSMO price movements but anyway, there are still more number and especially volume of $OSMO staking actions on 10th December compared to the other days.
We can also see that the share of Delegate (=stake) actions on 10th December has increased significantly which is interesting. On the other hand, the share of Undelegate and Redelegations have decreased significantly on 10th December.