Terradash Part 2: Staking and Supply
examine token supply and staking activity on Terra, both in terms of transactions, volumes and wallets.
\
Section 1:
Total Supply
Circulating Supply
🧠 Methodology:
- ez_swaps and ez_transfers tables have been used for finding Total and Circulating Supply.
- In determining total supply, we countered with some addresses that the "Outage of Luna" was their only record, and we can find any entrance od Luna to them. We sum up the total outage of Luna from these addresses.
- For circulating supply, we determined flow from swapping pools.
Section 2:
Staked LUNA
The percentage of LUNA staked
Distributed Staking rewards in USD trend
🧠 Methodology:
-
ez_staking has been used for finding staking details, and ez_transfers tables have been used for finding rewards.
-
To find rewards in USD, we had to find the luna 2 price from crosschain.core.fact_hourly_pricethen table, then multiplied it to Luna volume.
-
We can find reward transactions in ez_transfers with the below condition:
MESSAGE_VALUE['@type'] ='/cosmos.distribution.v1beta1.MsgWithdrawDelegatorReward'
- The results have been prepared in both US dollars and Luna volume.
Section 4:
Vesting Schedule
🧠 Methodology:
-
First, we explored the Inflow/Outflow for apps to find the Vesting Schedule.
-
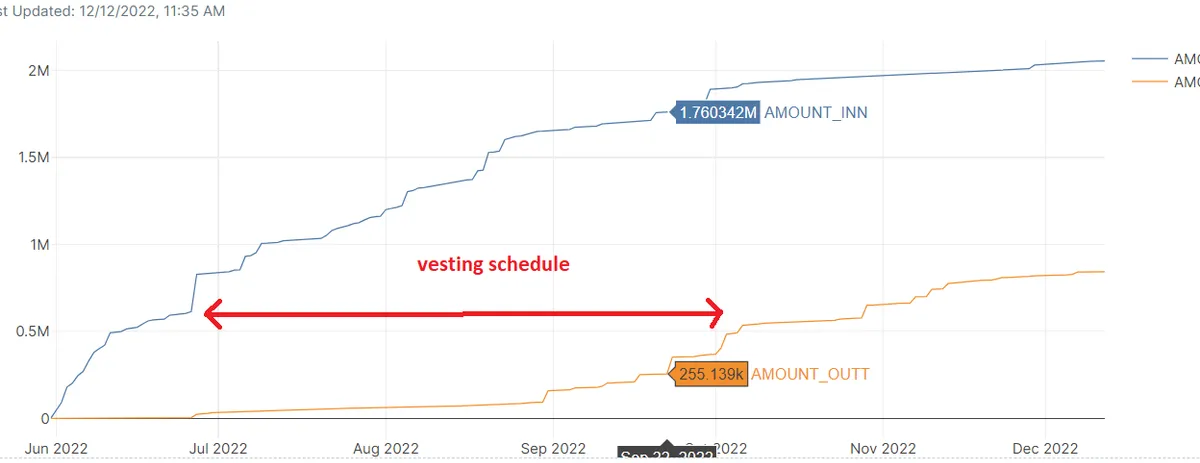
From the definition, the Vesting Schedule is the period that the primary Luna volume that is given to apps goes out from them. So to find it, we need to find Between the days when the amount in and out are equal. If we draw in and out volume and then draw a horizon line, the average distance between two in and out amounts is the Vesting Schedule. this is shown in the below figure.
-
DATEDIFF() function has been used for calculating day’s distance. floor() has been used for remoting decimals, and the below code for aligning equals in out volumes days.
 select avg(DATEDIFF(day, DATE, DATEE))
from table 1 a inner join table 2 b
on a.AMOUNT_INn=b.AMOUNT_outt
Section 5-1:
The percentage of LUNA IBC-ed out
🧠 Methodology:
- ez_transfers table has been used. the “bridge out” transaction could be found by the below condition
MESSAGE_TYPE='/ibc.applications.transfer.v1.MsgTransfer' and CURRENCY='uluna'
- The bridged-out destination could be from destination wallet addresses by the below code:
case
  when SUBSTR(receiverr, 0, 4) = 'osmo' then 'osmo'
  when SUBSTR(receiverr, 0, 4) = 'axel' then 'axelar'
  when SUBSTR(receiverr, 0, 4) = 'grav' then 'GRAV'
  when SUBSTR(receiverr, 0, 4) = 'secr' then 'secret'
  when SUBSTR(receiverr, 0, 4) = 'terr' then 'terra'
  when SUBSTR(receiverr, 0, 3) = 'cre' then 'CRE'
  when SUBSTR(receiverr, 0, 3) = 'sif' then 'SIF'
  when SUBSTR(receiverr, 0, 4) = 'kuji' then 'kujira'
  when SUBSTR(receiverr, 0, 4) = 'cosm' then 'cosmos'
  when SUBSTR(receiverr, 0, 4) = 'evmo' then 'evmos'
  when SUBSTR(receiverr, 0, 4) = 'stri' then 'STRI'
  when SUBSTR(receiverr, 0, 4) = 'juno' then 'juno'
  else null end as blockchain
- Now we have the bridge out information.
Question and Demands:
We’re working with Terra to rebuild the great Terradash , a dazzling dashboard full of analytic insights providing an overview of the entire Terra ecosystem— and we need your help! We are building out this new and improved Terradash in parts.
This week for Part 2: examine token supply and staking activity on Terra, both in terms of transactions, volumes and wallets. Be sure to include the following metrics (and more), noting any trends or outliers you see.
- Total Supply
- Circulating Supply
- Vesting Schedule
- % LUNA IBC-ed out
- Richlist (Top 100)
- of LUNA staked
- % of LUNA staked
- Staking rewards distributed in USD trend
We are not looking for data on Terra Classic for this bounty.
Please use the terra.core tables hosted on Flipside Crypto.
The final product at the end of this series will be a comprehensive dashboard combining together multiple aspects of the Terra blockchain. We want this to be highly shareable with a focus on UI/UX-- so keep this in mind during the early stages!
Understanding Terra
Terra is a payment system that resides and is built upon a blockchain. It was developed by South Korea-based Terraform Labs, which was founded in 2018 by Do Kwon and Daniel Shin. Do Kwon was formerly employed by Microsoft and Apple and founded a startup, Anyfi, which offered decentralized wireless mesh networking solutions. Shin is the founder and CEO of Asian payment technology company Chai—a Terra partner—and was co-founder of Korean e-commerce firm TMON, also known as Ticket Monster.23
The business rationale for developing Terra is outlined in a white paper from April 2019 that lists Do Kwon as one of its four co-authors.4 The paper proposes a cryptocurrency named Terra that is:
- Price-stable and growth-driven
- Based on the view that a price-stable cryptocurrency combines the best features of fiat currencies and Bitcoin (BTC).
- A successful new digital currency needs to maximize adoption to become useful as a medium of exchange.5
The paper notes that there is demand for a decentralized, price-stable money protocol in both fiat and blockchain economies, and such a protocol could be the best use case for cryptocurrencies.4
In its quest to become a leading e-commerce stablecoin payment and decentralized finance (DeFi) service provider, Terra has a growing ecosystem in the crypto space with 114 projects across DeFi, Web 3.0, and non-fungible tokens (NFTs). These projects include:
- Anchor Protocol: A fixed yield platform with borrowing yields and frictionless access
- Chai: A payments app with over 2 million users in South Korea
- LoTerra: A decentralized lottery platform built on the Terra blockchain
- Mirror Protocol: Allows for the creation of fungible assets or "synthetics" that track real-world asset prices
- Talis Protocol: A platform where artists can sell their creations and offer services
- Vega Protocol: A platform for minting and trading derivatives6
Terra and Luna
Because the primary value of stablecoins is derived from the stability of the price peg, theoretically bypassing the volatility typical of cryptocurrencies, the Terra protocol attempts to maintain the price of the Terra stablecoin by ensuring that the supply and demand for it are always balanced by employing arbitrage.1
Luna is the variable counterweight to the Terra stablecoin and absorbs its volatility. To understand how Terra works, envision the entire Terra "economy" to consist of a Terra pool and a Luna pool, which are used to adjust the price via incentives for network participants.
Read more:

References:
Thanks flipsidecrypto.com
✅ Observations
The total supply of Luna is ==1,043 B== Luna!
The total circulating supply is ==193 M== Luna!
Dividing the "total circulating supply of Luna" by the "total Luna supply" reveals that the circulating supply is ==18.5%== of the total Luna supply.
This metric has been visualized over time.
All values are given in percent.
The upward trend of this metric shows the fluctuation in circulating supply versus total supply from ==Aug 14 to date==.
Three strong jumps are in the periods [==20.-21. August==], [==26.-27. August==] and [==8.-9. September==] can be seen.
✅ Observations
"The Daily staking action number" diagram has been visualized here.
This diagram consists of three different processes.
- Delegate
- Undelegate
- Redelagate
As it is evident on the chart, ==90.8%== (==654641==)of this metric is related to the "Delegate" process.
Also, the delegation over time increase significantly, and the general trend of this metric over time is up-warding!
The second-ranking in this diagram belongs to the "Undelegate"
Clearly, this item is related to ==4.75%== (==34227==) of total staking.
By taking a close look at the trend of this item, it can be found that its trend is decreased.
The third process is "Redelegate" by having ==4.41%== (==31786==) share in this chart.
The amount of this metric is decreased from the beginning to date.
In the next chart, the "Daily staking action volume" is shown.
The first thing that attracts attention is the sharp downward trend of this index in the opposite of the "Daily staking action number."
As it is clear, all of the ==3== processes decreased significantly over time.
The maximum drop is related to the "Delegate."
The "Delegate," having ==73.3%== (==243422774.5== Luna), has the first rank in this chart.
The second rank is about "Undelegate" by ==15.8%== (==52657655.9== Luna), and the third rank belongs to "Redelegate" by ==10.9%== (==36216032.94== Luna)
All of the above information can be double-checked by the cumulative chart.
The static section contains this information:
==21.8%== of Luna has been staked.
The total staking reward is ==25.1 M$==!
==44.8K== reward receivers get more than ==326K== Luna reward, and the average reward per stakers is ==561$==.
The trend of "Daily staking reward" has been shown.
Two sharp spikes on the ==9th== of September and ==18== November.
These spikes are represented in the "Cumulative" chart, also.
Except for these two days, throughout the diagram, the slope of the cumulative chart is steady.
It means that the "Daily staking reward" hasn't had notable fluctuations over time.
The "Luna balance distribution" chart shows the number of wallets based on their asset.
The number of wallets that have ==0-1== Luna has the first rank in this chart, and their number is more than ==149.65 K.==
The wallets with ==1-10== Luna has the second rank by ==10.44K== wallet, and the third place is related to wallets with ==10-100== Luna asset by having ==3212== Luna.
The minimum number of wallets belongs to the range ==10000000-100000000== with only three wallets.
The next metric is the "Number of reward transactions per day"
This metric has a stable stream over time (Usually less than ==2000==) except ==9-11 September==.
In this period of time, there are spikes in this metric. The amount of "Number of reward transactions per day" in this period is ==8748== (==4== times more than the average condition), ==4664==, and ==3060==, respectively.
The "Daily average reward volume per transaction" is also represented. In a normal situation, this metric is less than ==200$==, but there is a sharp spike on ==18== November.
==4302.584== is the amount of reward per transaction on this date (More than ==200== times more than normal situation.)
The "Distribution of reward receivers" has also been represented.
Most of the rewards that reward receivers catch are between ==10-100==$ by ==13.749K==.
The range ==1-10$== is the second rank by ==8308== and the range ==100-1000$== is the third rank by ==7538==.
The range ==100K-1000K== has the lowest reward number by ==3==.
The "Distribution of reward in dollars" has been shown in several ranges.
Most of the rewards are in the range of ==1-10$== by ==69.758K== number.
The range ==10-100$== has the second ranking by ==54.339K== rewards, and the third range is ==0-1 $== by more than ==45 K== rewards.
Like the previous chart, The range ==100K-1000K== has the lowest reward number by ==50==.
✅ Observations
“Daily "Bridged out" active users,” and “Daily Luna “Bridged out the“ transaction number“ charts represented here.
Both diagrams have the same trend and detail roughly.
The "Axelar" has the maximum share in terms of active users. The "Kujira" is the next one.
All of the other networks have been shown, and the number of each network has been determined.
The trend of this metric shows a strong start, and the number of active users is more than ==1200== (May ==29==), but this stream dropped significantly after a couple of days.
After the beginning days, the new users chart experienced a steady state approximately, and now the number of new users is less than ==50==!
The "Daily Luna "Bridged out" volume by chains" is also investigated in this section.
Evidently, a strong start can be seen at the start of this metric.
On ==30th== May, the amplitude of this metric was more than ==80K==!
The share of each chain has been detected and showed also.
At first, "Axelar" has great dominance in this index. On some days, all of the "Bridged out" volume belongs to the "Axelar" chain!
But the share chains changed over time.
Clearly, the share of "Kujira" has greatly changed over time.
Another point is that the general stream of this index hasn’t any special trend and has indeterminate fluctuations.
As the last item in this section and dashboard, the "Luna "Bridged out" volume by chains" has been reported by two charts.
Bar and donate chart.
The maximum "Bridged out" volume is in the "Osmo" chain by more than ==382K== Luna (==73.5%==).
The "Kujira" and "Secret" by more than ==109K== (==21.1%==), and ==19K== (==3.7%==) are in second and third place, respectively.
✅ Observations
In this section, the rich list (==Top 100==) of the Terra ecosystem is represented.
As is evident, there are three wallets with a notable amount of liquidity.
Here's the ==top 5== of the rich list with their balance.
RECEIVEE USER BALANCE
68080561169833 terra1tygms3xhhs3yv487phx3dw4a95jn7t7l8l07dr 64909897.443083
44326394342073 terra1jrq7xa63a4qgpdgtj70k8yz5p32ps9r7mlj3yr 38303726.342073
35218777520456 terra1jv65s3grqf6v6jl3dp4t6c9t9rk99cd8pm7utl 12920352.317177
44972371090587 terra13s4gwzxv6dycfctvddfuy6r3zm7d6zklynzzj5 8316429.784558
5674606402839 terra1gz50vgzjssefzmld0kfkt7sfvejgel9znun9chsc82k09xfess5qqu8qyc 5466271.402839
✅ Observations
Based on the explanations and definitions in the methodology of section 4:
The vesting schedule is ==135.4==!
Also, the "Luna in/out from DeFi" has been drawn.
The outage amount of Luna before the ==26== June is so little, and it is less than ==4000== Luna!
After this time, the outage amount rises significantly. Today this amount is more than ==842K== Luna!
On the opposite of the outage, the entrance of liquidity in DeFi is an upward trend from the beginning!
The difference between entrance and outage liquidity in this chart s more than ==1.1M== Luna!
Today the entrance of the Luna to the DeFi is more than ==2.05M== Luna!
✅ Observations
Based on the statistical data:
520K Luna has been "Bridged out" by more than ==11.67K== transactions and by ==6370== users!
The average of "Bridged out" Luna per transaction is ==44.6== Luna, and the average of "Bridged out" Luna per user is ==81.7== Luna.
The "Daily bridged out Luna":
Based on this graph, the "Bridging out" Luna peaked sharply on the ==30th== of May ==2022== by more than ==89K== Luna.
After this time, the "Bridging out" volume decreased severely; usually, this amount is less than ==1000== Luna!
The "bridged out" volume of today (==12== December) was ==166.96== Luna!
If you look at the "Cumulative" chart, you can see that the slope of this line chart is so sharp at first.
Gradually the slope of the line chart decreased.
The fixed slope shows that there is no notable happening in the investigated index!
"The ratio of Luna volume "Bridging out" to circulating supply (in percent)" shows this:
The peak of this metric is ==46.45%== on August ==14th==. After this point, the downward trend of this indicator begins.
A sharp drop occurred on August ==20th==. The percentage of this metric dropped from ==42%== to ==33%== in just one day! ==9%== only in one day!
Another drop can be seen on August ==26th==! From ==31%== to ==28%==!
The third sharp decline comes on September 8th from ==27.7%== to ==25.7%==.
Only during these three sharp declines can we see a more than ==14%== drop in "The ratio of Luna volume "bridged out" to circulating supply "“
The "Distribution of bridges based on their "Bridged out" Luna number" and The "Distribution of "Bridged out" transaction base of their volume range" are the next charts.
Based on the "Distribution of bridges based on their "Bridged out" Luna number":
Most of the bridges are in the range of ==1-10== Luna!
It means these badgers bridged out ==1-10== Luna (==2820== times!)
Range ==10-100== is the second rank (==2042== times), and range ==0-1== is the third rank (==1041== times).
In other words, bridgers "Bridged out" ==2042== times between ==10-100== Luna and ==1041== times between ==0-1== Luna!
Based on the "Distribution of "Bridged out" transaction base of their volume range":
==6077== transaction is done to "Bridged out" Luna! The amount of these transactions are between ==1-10== Luna! (First rank) ==3079== transaction with ==10-100== Luna was done as the second rank in this metric. The third rank is about range ==0-1== by ==2595== transactions.
In the following action, the "Top 20 addresses with the most "Bridged out" Luna" represented.
Here are the top 3 of these addresses with their volume.
VOLUME SENDERR
2839 terra1akh86cyazxvwz34z4k4656uug3um4vus3tm3xv
3903.3 terra1e4lwv5xkymcrz8sfthl4uqkzw0vwtw28kz52h3
2948 terra1f0t58c2zcqszcjsjg9k36qv7jmsce48nthn72k
The last chart is Luna's "Average Bridged Out".
We cannot see any specific trend in this chart.
The highest average on this metric is ==253.0316== on July ==2nd==.
What Is the Vesting Period?
The vesting period, also called the token lockup period, refers to a period in which tokens sold in the pre-sale ICO stage and offered to partners and project team members as incentives for their contribution are prevented from being sold for a specific period. A vesting schedule is announced by the project to release these tokens at intervals throughout a given period.
Major Reasons for Token Lockup
A healthy token economy requires that most tokens are held by investors and not released into the market. Locking up tokens allows the team to prevent the value of their token from dumping. It also disables the team members to sell their tokens right after the trading goes live, hence, protecting the interest of the holders.
By locking up tokens, projects prevent dumpers from crashing the price as soon as the token gets listed on any exchange. It is usually a part of their anti-dump policy to attract more investors by gaining their trust in the longevity of the project.
Benefits of Token Lockup
Here are some of the benefits of having a lockup period:
- Protects token holders from large price fluctuations, as early investors will have to wait for a specific period before selling their assets.
- Token lockup provides time for a product to be developed and launched, especially if there is no prototype yet. During this period, investors can evaluate the progress of the project and decide whether they want to hold on to their tokens or exchange them for another currency, such as Ether or Bitcoin.
What is a circulating supply?
A cryptocurrency circulating supply refers to the number of tokens in circulation in the market at any given time that are available for trade.
The circulation supply metric is used to define the market capitalization of a given cryptocurrency and accounts for the size of its economy. A cryptocurrency’s market cap is obtained by multiplying the price per unit by the number of all the existing coins in a blockchain, even the ones that have been lost or confiscated.
Somewhat emblematic is the example of Bitcoin and its creator, Satoshi Nakamoto, who mined millions of BTC in the early years but never moved them. Whatever the reason behind such a decision, all those Bitcoin are still included in the total circulating supply of the cryptocurrency.
There is a sub-metric of market cap, denominated realized market cap, which calculates the price of a coin when it was last moved as opposed to the current value. Realized market cap does not include coins that have been lost or are dormant in a blockchain, reducing their impact on the price.
Some cryptocurrencies, like Bitcoin, have a finite supply, and their circulation is only increased through mining. On the other hand, developers of some more centralized tokens can increase their circulation supply through instantaneous minting, a bit like central banks.
Circulation supply can also decrease by a process called burning, which means destroying the coins by sending them to a wallet whose keys are not available to anyone. For this reason, the circulation supply metric should be considered somehow approximate.
What is a total supply?
A token’s total supply is calculated by adding the circulating supply to the number of coins that have been mined but not yet distributed in the market.
In the case of coins reserved for staking rewards, for instance, they have already been minted. Still, they are locked up in the project’s protocol and are only distributed when the staker meets a particular condition.
Another instance occurs when a new cryptocurrency project is launched, and the number of tokens issued is not equal to the one being distributed. These types of measures are usually taken to follow demand and not oversupply a cryptocurrency that could, as a result, affect the price negatively.
It could also be the case of tokens created by developers at a blockchain’s launch as premine to use as development funds but have not been circulated yet. Moreover, burned coins or tokens are not calculated in the total supply, as they are tokens sent and permanently locked up in a burned address that nobody will ever be able to access and are therefore eliminated forever.
It is possible to increase the total token supply, depending on the crypto protocol’s rules. With Bitcoin, for instance, unless there is maximum consensus to change the protocol, its total supply of 21 million coins can’t ever be changed. With other tokens, developers could potentially change a protocol’s supply rule by planning in advance a variable in the smart contract.
Total supply vs. circulating supply
How a price may change in the future is a crucial assessment for an investor who could plan a different strategy depending on how each metric performs against the total supply. Total and circulating supply can change over time, so it’s essential to keep up to date with the latest developments of a project.
A summary of differences between total supply, maximum and circulating supply can be found in the below table:

Cryptocurrency coins or tokens can be easily compared to publicly traded shares in the stock market, as their price reflects supply and demand conditions. The more coins are in existence, the more demand there needs to be for a price to increase.
A low supply means that the token (a share) is scarce and if in high demand, its price will likely rise. On the other hand, if the demand for a cryptocurrency is low but has a large supply, its price may drop.