Question
Create a dashboard with at least 5 different metrics of your choosing showing Solana's health and adoption as a blockchain as market conditions have soured.
How does Solana compare to Ethereum in terms of user behavior in both Defi and NFTs over the past two months. Are there certain trends distinguishable to each blockchain?
Build an argument that if you were a builder launching a project in the next year, that Solana would be the place to do so citing those metrics above along with your knowledge of the blockchain.
On November 9, 2021, Bitcoin recorded a new ATH price . From this date on, the price of Bitcoin gradually decreased, or in other words, the crypto market entered a bearish phase.In this dashboard, by considering metrics, the performance of Solana blockchain in the bear market is examined. For better comparison, Solana performance is compared to Ethereum chain performance.
With the start of the downtrend, the number of transactions on the Solana chain gradually decreased until April 9, 2022, when the number of transactions was 10.05M. It is noteworthy that on April 9, more than 34% of the transactions were unsuccessful. But from this date onwards, the number of transactions has gradually increased. Just reducing the number of transactions can not indicate the reason for the weakness of a blockchain. Here the gradual decrease in the number of transactions is due to less users activity. But the chart below shows two significant reductions in the number of transactions. (January 7 and 21) The Less fluctuation in the number of transactionsthe number of transactions in a chain, the more stable the blockchain. Because in some cases, technical factors reduce the number of transactions.
From November 10 until May 17, the share of failed transactions has gradually decreased, but since May 17, the share of failed transactions in total transactions has gradually increased. For example:
During the crypto market crash days (May 11 to May 13), more than half of the transactions on the Solana chain were failed.
Similar to the Solana chain, the number of Ethereum blockchain transactions in the bear market has also declined.
The share of unsuccessful transactions in the total transactions on the Ethereum chain is about 2% to 3%. But the percentage of failed daily transactions on the Solana chain is much higher.
2. Swap Volume
SOL is Solana's native and utility token that provides a means of transferring value as well as blockchain security through staking. That is why the SOL swap volume has been obtained since November 10, 2021. Despite the declining conditions in the crypto market, the volume of daily SOL swaps has gradually increased since April. This could indicate the growth of the Solana ecosystem, as all platforms on the chain need SOL to conduct their transactions.
3. Transactions Per Second (TPS)
The number of transactions per second (TPS) is a metric of the flexibility of a blockchain. The higher the TPS of a network, the more flexible that network is. Some projects require a high number of transactions per second. These projects should opt a blockchain with high TPS .
As mentioned above, the number of transactions on the Solana and Ethereum chains has decreased in bear market conditions. Obviously, this also affects TPS. But comparing TPS between Solana and Ethereum, we can say that Solana TPS is much higher than Ethereum.
4. Transactions Fee (Tx Fee)
A transaction fee is paid when a certain amount of cryptocurrency is transferred from one wallet to another. Transaction fees are flexible in nature and can vary based on how busy the blockchain is. Although from November 10, 2021 onwards, the fee on the Solana chain gradually increased, but the fee on the Solana chain is still very small.
In contrast to the Solana chain, fees on Ethereum have been steadily declining from about $ 60 on November 10 to about $ 6. But the fees on the Ethereum chain are still far higher than on Solana. In fact, the transaction fee on the Solana chain is close to zero compared to Ethereum!
In this section, the correlation between transaction fees and the number of transactions on the Solana chain is measured and compared with the same amount on the Ethereum network. The next section shows the scatter plot between the number of transactions and the transaction fee on Solana & Ethereum chains.
Interestingly, the correlation coefficient is negative for Solana and positive for Ethereum. In terms of size, the correlation between the above variables is strong in the Solana chain and moderate in the Ethereum chain. Negative correlation between transaction fee and number of transactions means that as the number of transactions decreases, the transaction fee increases and vice versa, as the number of transactions increases, the fee decreases. This is a negative feature in the bear market and a positive feature in the cow market. Ethereum correlation coefficient is a positive feature in the bear market and a negative feature in the cow market.
Solana: Correlation(Tx_count, Tx_Fee)=-0.75
Ethereum: Correlation(Tx_count, Tx_Fee)=+0.42
In the next step, the sales volume in the NFT marketplaces for Solana is obtained and compared with the same amount in Opensea as the most significant NFT marketplace on the Ethereum chain.
Sales volume in Solana's NFT marketplaces is less than Ethereum. But comparing the trend of the two charts shows that unlike Ethereum, the volume of NFT sales on Solana has been upward and this shows that more users are attracted to NFT marketplaces on the Solana chain..
We used defi Llama data to check the status of Defi projects on the Solana and Ethereum chains. >> This data is for May 30.
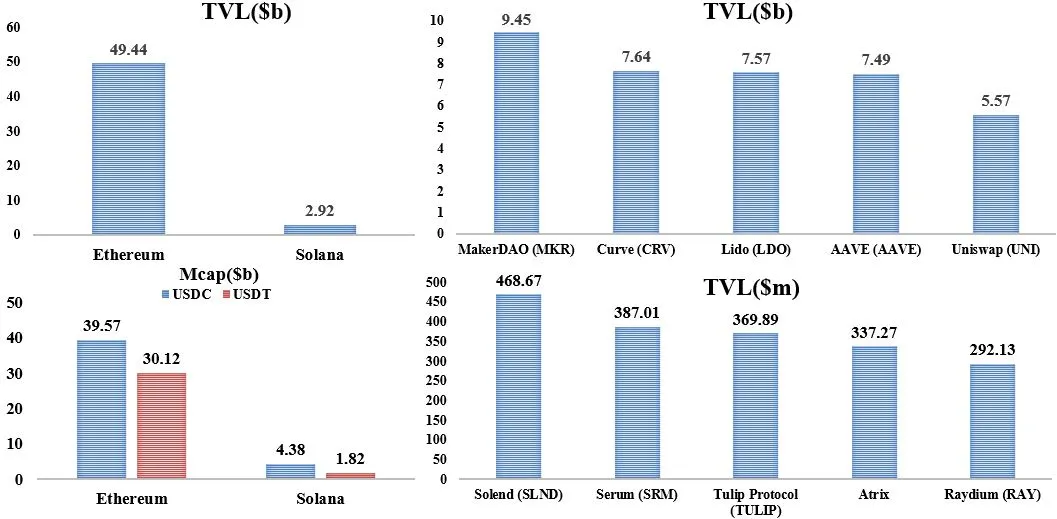
The total value locked (TVL) in Defi projects on Ethereum is much higher than Solana. On the other hand, the TVL value for the top 5 Defi projects on the Ethereum and Solana chains is shown in the diagram above. Finally, the Marketcap value for USDC and USDT stablecoins on Ethereum is much higher than Solana.
Conclusion
- 💡 Despite the bear market, the Solana chain has been able to maintain its health. Many of the above indicators illustrate this point.
- 💡 Ethereum ranks higher than Solana in many indicators, but looking at the trend of the data, it can be seen that many positive indicators for Solana are growing day by day.
As a builder, if we want to implement and run a platform on a chain, we choose a chain that:
1- The number of successful transactions must be much more than the number of failed transactions. In other words, the success rate for its transactions must be high.
✔Solana is a blockchain with a success rate of more than 70%.
2- Chains like Ethereum with low number of transactions per second are not suitable if you need a high number of transactions on the platform. A chain with a high TPS value should be selected.
✔Solana is a network that can provide a large number of transactions per second for its users.
3- If the transaction fee is low, it is possible to use the platform for a wide range of users.
✔Solana is a chain with a fee close to zero.