Flash Bounty: Post Merge Behavior
The merge has occurred. How have users responded in days that followed?
What was The Merge?
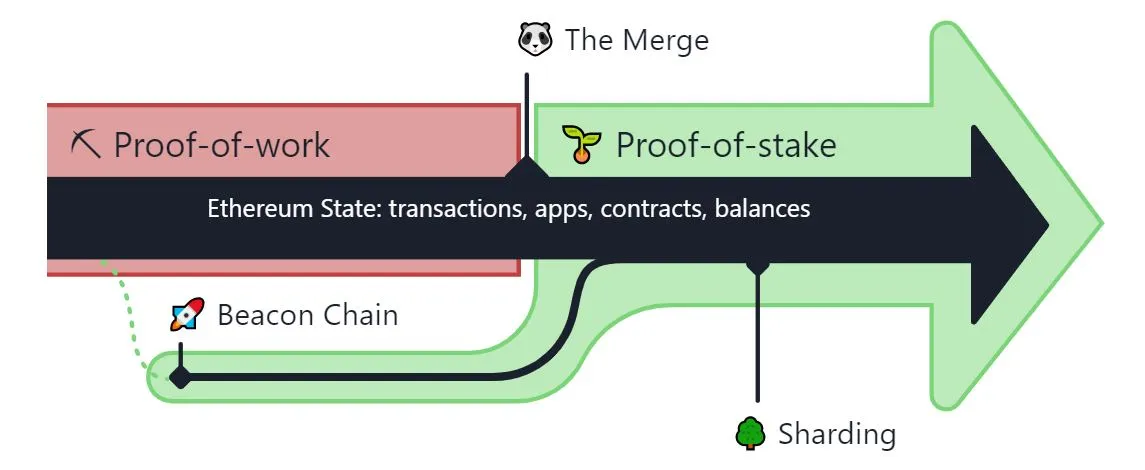
The Merge was the joining of the original execution layer of Ethereum (the Mainnet that has existed since genesis) with its new proof-of-stake consensus layer, the Beacon Chain. It eliminated the need for energy-intensive mining and instead enabled the network to be secured using staked ETH. It was a truly exciting step in realizing the Ethereum vision—more scalability, security, and sustainability.
Initially, the Beacon Chain shipped separately from Mainnet. Ethereum Mainnet - with all it's accounts, balances, smart contracts, and blockchain state - continued to be secured by proof-of-work, even while the Beacon Chain ran in parallel using proof-of-stake. The Merge was when these two systems finally came together, and proof-of-work was permanently replaced by proof-of-stake.
Imagine Ethereum is a spaceship that launched before it was quite ready for an interstellar voyage. With the Beacon Chain, the community built a new engine and a hardened hull. After significant testing, it became time to hot-swap the new engine for the old one mid-flight. This merged the new, more efficient engine into the existing ship enabling it to put in some serious lightyears and take on the universe.
Methodology
Greetings ! In this dashboard i will analyze several metrics of users behavior before and after The Merge , for example we will see the number of daily unique users that interacted with Ethereum before The Merge and after it , also we will analyze daily number of transactions , ETH token (native) transfers , average gas price gwei , transaction fee and swaps . we will see users behavior on daily basis and week before The Merge occurred and the week after it .
Week before The Merge : Sep-08-2022 till Sep-14-2022
Week after The Merge : Sep-15-2022 till Sep-21-2022
In this dashboard i will use ethereum.core.fact_transactions table to get information about transactions , active unique users , gas price and transaction fee .
ill use ethereum.core.ez_eth_transfers table to get data about ETH token transferred in this platform .
ill use ethereum.core.ez_dex_swaps table to get data about Ethereum daily total swaps and daily swaps and unique swappers .
Also in the most of daily charts i set starting date at Aug-2022 to better readability .
Different sections of this dashboard :
- Transactions ( Daily & week before & after The Merge occurred )
- Unique active users ( Daily & week before & after The Merge occurred )
- ETH token transfers ( Daily & week before & after The Merge occurred )
- Average gas price Gwei and transactions fee ( Daily & week before & after The Merge occurred )
- Swaps & Swappers ( Daily & week before & after The Merge occurred)
Transactions ( Daily & week before & after The Merge occurred )
Unique active users ( Daily & week before & after The Merge occurred )
ETH token transfers ( Daily & week before & after The Merge occurred )
Average gas price Gwei and transactions fee ( Daily & week before & after The Merge occurred )
Swaps & Swappers ( Daily & week before & after The Merge occurred)
Conclusions
According to the all charts and visualizations that we saw in this dashboard we can say :
Daily number of transactions slightly increased after The Merge since Sep-15-2022 till Sep-17-2022 , and according to the week before & after pie chart we can see number of transactions is 8.44M week after The Merge , while the week before The Merge number of transactions was 7.46M , we see almost 1M transactions increased after The Merge .
By looking at the unique active users charts and visualizations we can see number of active users slightly increased after The Merge since Sep-15-2022 till Sep-17-2022 , by looking at the unique active users pie chart that is showing active users week before The Merge and week after The Merge we can see number of unique active users increase after The Merge , number of active users week after The Merge is 2.145M while week before The Merge number of active users was 1.814M we can see number of unique active users increased almost by 313K .
According to ETH token transfers chart and visualizations we can see ETH token transfers is like before and normal , we can’t see any change or weird thing about it .
According to the daily average transactions gas price and transactions fee visualizations we can see average gas price and average transactions fee reduced slightly after The Merge , by looking at the pie chart about average gas price week before & after The merge we can see a difference which week after The Merge gas price reduced to 15.11 while the week before The merge gas price was 20.53 . by looking at the pie chart about week before and week after The Merge we can see transactions fee reduced from 0.0017 to 0.0012 week after The Merge .
Thanks for reading :smiley: