Transaction Failure
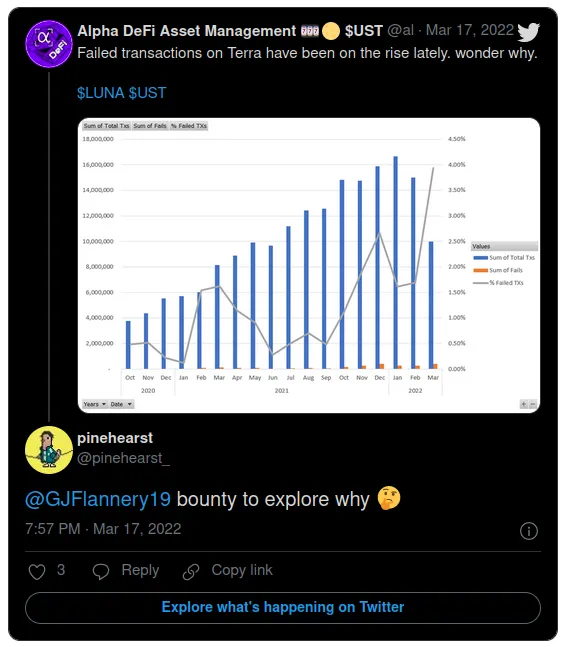
Q169. Make reference to this tweet: https://twitter.com/alphaDefi_/status/1504522066674003972/photo/1 Establish the failed transaction rate for Terra over a time period of your choosing. Is this analysis correct? Additionally, make a case for what is causing the failure transaction rate you assess, and provide recommendations to mitigate it.
Methodology
Section 1 - Total and failed transactions
To obtain an analogue visualization as the one in the tweet above, I created 2 CTE with constrains tx_status = 'SUCCEEDED' and tx_status = 'FAILED', each counting the number of transactions with the date truncated by month. These tables are then joined to show the total successful and failed transaction per month in figure 1.
The time frame is then changed to days in the second query to obtain a more detailed visualization as seen in figure 2.
Section 2 - Human / Bot behaviour
Following some of the replies to the tweet, I investigated what the relationship was between failed percentage of "human" and "bot" users. I defined these two user types based on the activity measured in total interactions (count(distinct tx_id)) in the month of March. If a user had 300 or more than transactions since March 1st, it was considered a bot and with less than 300 it was considered a human.
I then followed a similar structure as in Section 1 to calculate the percentage of failed bot and human transactions since November 1st 2021, which is shown in Figure 3. There is some discrepancy in the total and failed transaction numbers between Figures 2 and 3, that is why I repeated the query to show the evolution in March only. I left Figure 3 because it shows the change in trend very well, although the exact numbers might not be completely accurate.
Section 3 - Sent to addresses failures
In an attempt to shed some light on the causes, I discovered that a high percentage of failures came from specific addresses. More specifically, there is one sent-to address which is responsible for a vast majority of failed transactions on certain days. I calculated the number of failed transactions with the same structure as in Section 1 to count the number of failed transactions to all addresses and to this one address in particular.
Conclusions
The increase in failed transactions in March pointed out in the tweet is related to the failed transactions from "bots", users with 300 tx/month or more usually hinting at some automated transaction system.
The failure rate of human users (less than 300 tx/month) seems to be linked to single behaviour of certain sent-to addresses that would explain the high peaks as seen in Figure 7. In this case, a terraswap address was identified, meaning some technical issue like max. spread defined in the transaction was exceeded or liquidity of the pool was drained as the transaction was being processed by the network.
The failure rate of bot users may be caused by similar issues or by failures in the automation of trading bots, meaning their strategy is somehow not working anymore. I don't have enough information on how the bot trading are programmed to dive into this right now, so I cannot provide deeper insight. Looking forward to see other people's submission to learn more on this issue.
As a side note for this bounty, I really like how the it came to life: from a tweet hinting at some problem, a reply pinging a Flipside bounty creator and a new bounty posted one day later, it is a very nice practical example of how Community Enabled Analytics can improve the understanding in the cryptospace through collaboration.
Figure 1 shows the same chart as the tweet, which confirms the situation presented by @alphaDefi. December 2021 is the first month in the timeframe analysed with a failed percentage over 2%, having retraced on January and February to levels around 1.5%. On March, an increase to 3.7% prompts to some real cause of the network transaction rate deteriorating.
Figure 2 shows the total and failed transactions per day since November 2021, where interesting trends can be spotted. On late November and Decemeber 2021m there were some exagerated spikes in failed transactions, amounting up to 15% and 11% of the total transactions. These were single events after which failed percentage decrease to similar levels as before, although some days were still over 2%. Between end of February and mid March, a steady increase in the daily percentage of failed transactions has been in play.
...and a simple reply which created a new bounty. Let there be analysis!
Figure 3 shows the change in the distribution of failed transactions for bots and humans as the percentage of failed transactions. On February 22nd, the percentage of failed bot transactions flipped the percentage of failed human transactions in what could be the start of the trend mentioned in the tweet.
Comparing the timeframe around December 2021 and March 2022, we distinguish two different behaviours:
- Low bot failed txs and extremely high spikes in human failed txs (December 2021)
- Bot failed txs trending higher that ever with very small spikes in human failed txs (March 2022)
As mentioned in the Methodology section, total transactions and failed transactions have a 10-20% discrepancy compared to Figure 1 values, therefore they are not shown and the graph should be used to asses the trend, not specific values.
Figure 4 shows in detail the distribution of bots and human failed transactions in March. The same behaviour as in Figure 3 can be seen, bot failed txs trending higher with very small spikes in human failed txs.
This time, total and failed transactions for all users have been added since the numbers are the same as in Figure 1.
Figures 5 and 6 shows another visualization of the distribution between bot and human transactions in March. Although bot transactions account for around 70-80% of total transactions (Fig. 6), they usually account for 85-90% of failed transactions, except for single days (Fig. 5).
On Figure 7, the failed transactions to address terra17e6u8gq0m0tq8gcvdul2nqqxl2gwcpwp77leu5 compared to sent to addresses in shown since Novemeber 1st. November 24th, December 3rd and 8th are extremely high peaks for failed transactions and this address accounts a very significant part of them (>50%). Also on February 12th, March 8th and March 15th a high number of transactions to this address fail. All these days are linked to high human failed percentage on Figure 3. From the terra.labels table, this address belongs to terraswap pool.