NEAR Mega Dashboard Architecture
This dashboard includes activity on Near in terms of transactions, blocks, wallets, supply and staking
This dashboard displays the following metrics:
Transactions
- Max, Min, Average and Median Transaction Fee per Transaction per week
- Total Transaction Fees per week
- Total number of transactions per week
- Cumulative number of transactions
- Average and Peak transactions per second (TPS) per week
- Success rate (% of succeded Txs)
- Recent Txs
Blocks
- Min, Max and Average block time per week
- Average transactions per block - TPB
Wallets
- Total number of new wallets per week
- Total number of active wallets per week
- Cumulative number of new wallets per week
- Average Number of Txs per wallet per week
Supply
- Total Supply of NEAR token
- Circulating Supply of NEAR token
- Circulating supply + several metrics changed over time: the price of NEAR, Unique Users and Number of Transactions
NEAR staked
- Stakes/Unstakes by number of Transactions
- Stakes/Unstakes by amount
- Size of Pools
- Number of Validators
\
TRANSACTIONS
BLOCKS
WALLETS
SUPPLY
NEAR STAKED
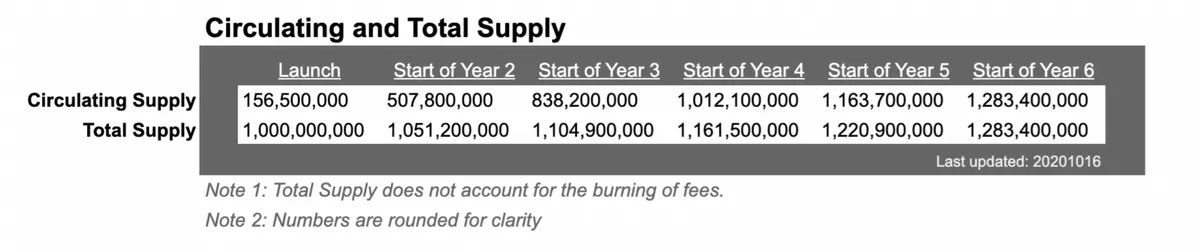
It is a little difficult to calculate the circulating supply through user balances, so I took the information from the link.
There were 1,000,000,000 NEAR tokens created at Genesis on April 22, 2020. Further, according to the plan, + 5% every year from the total supply.
In the screenshot below you can see the 5-year planю.The current value can be viewed at the link.
I also added how the value of the Circulating supply and several metrics changed over time: the price of NEAR, Unique Users and Number of Transactions
Source : near.core.fact_transactions
Only successful transactions are used in this dashboard (except for the Success Rate and the table with the latest transactions)
For the examination of blocks also was usednear.core.fact_blocks
Date: Since 01-01-2022
Сounters do not include current day
Period: Weekly
For counters it is possible to choose the time period (yesterday, last week, last months, last 6 months, last 1 year) For charts, the entire available period is used
Currency: NEAR
Twitter Post: Link