The “Flippening” Comparison
Optimism and Arbitrum (two of the largest Ethereum Layer-2 scaling solutions) flipped Ethereum in combined transaction volume
In the charts below, we see that this is true. The news that number of transactions on Optimism and Arbitrum in total exceeded number of transactions on Ethereum was published on January 11th. However, since November 6, we can observe similar days.
But anyway, it’s a good occasion to compare and contrast these two major L2 chains
SUMMARY
Optimism and Arbitrum (two of the largest Ethereum Layer-2 scaling solutions. However, they have some differences among themselves.
For example, Optimism leverages Ethereum Virtual Machine, native token - OP, uses single-round fraud proofs and tx gas is bound by Layer 1 block gas limit; Arbitrum has its own Arbitrum Virtual Machine, doesn’t have a native token, uses multi-round fraud proofs and L1 block gas limit doesn’t matter as L2 txs are never entirely executed on L2.
Inside the dashboard, you can read in more detail about the analysis of the main metrics and the differences in them between Arbitrum and Optimism, below is a summary:
-
Both of analized protocols allow for much higher throughput than Ethereum mainnet for lower fees
-
On January Optimism and Arbitrum processed more transactions then Ethereum mainnet
-
On this period Optimism also overtook Arbitrum in terms of transaction volumes, average number of transactions per secod (TPS), total gas used, total fee volume, number of daily active and new wallets
-
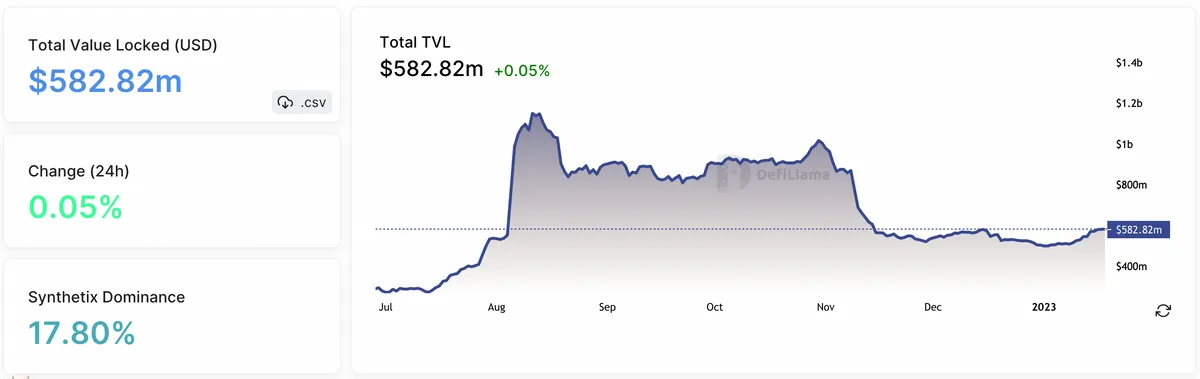
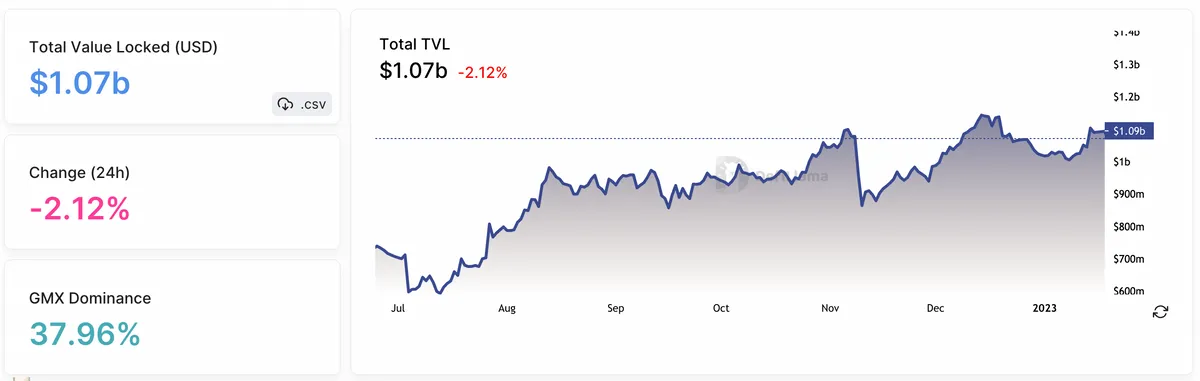
Arbitrum protocol has the bigger total value locked (TVL) then Optimism. According to data from defillama, Arbitrum has a TVL of $1.07 billion (2,41% of TVL all chains), while Optimism has $582,82 million (1,32% of TVL all chains)
More detailed conclusions based on the analytics of these protocols can be found above inside the dashboard
Сomparison criterias:
- Native token
- TVL
- Transactions (number of transactions, average transactions per secon (TPS), average number of transactions per user, success rate, transaction volume, average transaction size)
- Gas and fee (min, max, median and average gas price, average gas used per transaction)
- Wallets (number of new and daily active users)
GAS FEE AND GAS USED
WALLETS
NATIVE TOKEN
First of all, Arbitrum doesn’t have a token yet, while Optimism does
OP is a native Optimism token. On the chart we can observe the OP price to USD and also 7 and 30 days moving average price.
If the price of an asset is above the moving average, then the trend is up. What we see on the chart since the beginning of January
TOTAL VALUE LOCKED (TVL)
TVL (Total Value Locked) is the total value of all locked cryptocurrencies in smart contracts of the DeFi protocol. This indicator shows how much money was invested in the project.
On the charts above we see the dynamics of Arbitrum (top left) and Optimism (top right) TVL in USD. TVL of Arbitrum is almost 2 times higher.
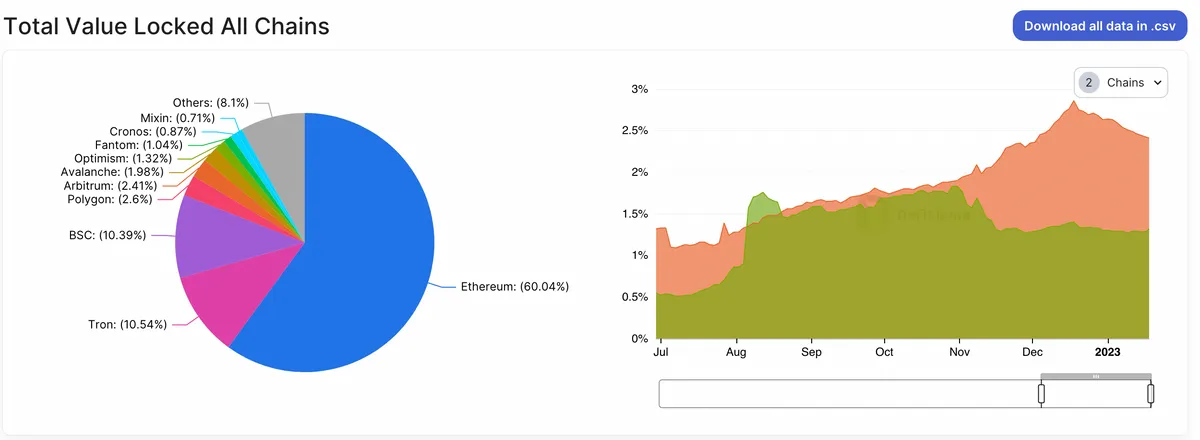
On the left picture we can observe TVL distribution of all chains and dynamic of Arbitrum and Optimism % TVL since July.
TVL Arbitrum is 2.41% of the total, Optimism is 1.32%. From August to November, the share of TVL for both chains was almost the same, then the share of TVL of Arbitrum increased, while Optimism, on the contrary, decreased
\n
OPTIMISM
\
-
From the end of August to mid-December, the number of transactions on Arbitrum every day exceeds the number of transactions on Optimism by almost 2 times, then the difference in the number of transactions between this two chains decreases and from the end of November we observe a picture when the number of transactions on Optimism exceeds Arbitrum.
On the chart showing the daily cumulative number of transactions, we clearly see that until September the cumulative value was at the same level, then the Arbitrum takes a very sharp lead. However, after some time, the growth rate of Arbitrum slows down, and the growth rate of the number of transactions on Optimism continues to grow until today
-
The average number of transactions per second (TPS) on Optimism grows over the period from about 1 to 8.8 transactions per second. The Arbitrum TPS value grew until 9 of November, reaching a peak of 9.62 transactions per second and then the value began to decline
-
The average share of successful transactions for almost all days from June to January is higher on Arbitrum and is in the range of 90-99%. On Optimism, the percentage of successful transactions is in the range of 85-97%. From the lower values of the success rate on Arbitrum, 2 days can be noticed: August 26 (75.3%) and December 30 (80.2%). The lower values of the success rate on Optimism were approximately 84.1% twice during the analyzed period. We can also observe that since the beginning of January, the success rate of Optimism is slightly higher than on the Arbitrum
-
Until September, we see a picture when the number of transactions for the wallet on Optimism is almost 2 times higher than on Arbitrum. Further, this pattern reverses until the end of October, but with a smaller difference. Since the end of October, the number of transactions per wallet on both chains has been approximately the same
-
As for types of transactions, the most popular are transfer and swap.
On Optimism, the share of transfers almost until the end of September was 70-76%, the share of swaps - 24-26%, after the end of September the share of transfers increased (76-80%), while the share of swaps, on the contrary, decreased (10-15%). The distribution between the types of transactions on Arbitrum is approximately the same throughout the entire time: transfers 80-85%, swaps 10-15%
-
Transaction volume in ETH on Arbitrum is higher than on Optimism during the analyzed period. On september we also see a significant increase in the total volume of transactions on Arbitrum
Each transaction you send to the network costs gas and charges you a fee for gas. This fee is used to indirectly pay the people that keep the network infrastructure, and to incentivize developers of smart contracts.
- The first difference between the considered chains is that on Optimism transaction gas is bound by Layer 1 block gas limit, on Arbitrum block gas limit doesn’t matter as Layer 2 transactions are never antirely executed on Layer 1
- Until December, more gas per transaction was spent on Optimism than on Arbitrum, the last month gas used per transaction on both chains is about the same level, on Arbitrum the value is slightly higher
- As for total fee and gas price, much higher on Optimism. This is due to the fact that on Optimism the cost of gas for L1 is also added, which significantly exceeds the cost of gas for L2
Next, we will look at the daily number of unique and new wallets
- During the main part of the analyzed period, the number of new and unique wallets is higher on Arbitrum
- Since December 20, the number of unique wallets on Optimism exceeds the number on Arbitrum, mainly due to new wallets
- The number of new users for six months on Arbitrum has increased by about 329 times, on Optimism - by 466 times