Sushi Activity on Ethereum
How did the recent spike in market volatility affect the overall activity of sushi on Ethereum? Analyze both swaps and lendings?
Info
-
SushiSwap is software running on Ethereum that seeks to incentivize a network of users to operate a platform where users can buy and sell crypto assets. Similar to platforms like Uniswap and Balancer, SushiSwap uses a collection of liquidity pools to achieve this goal.
-
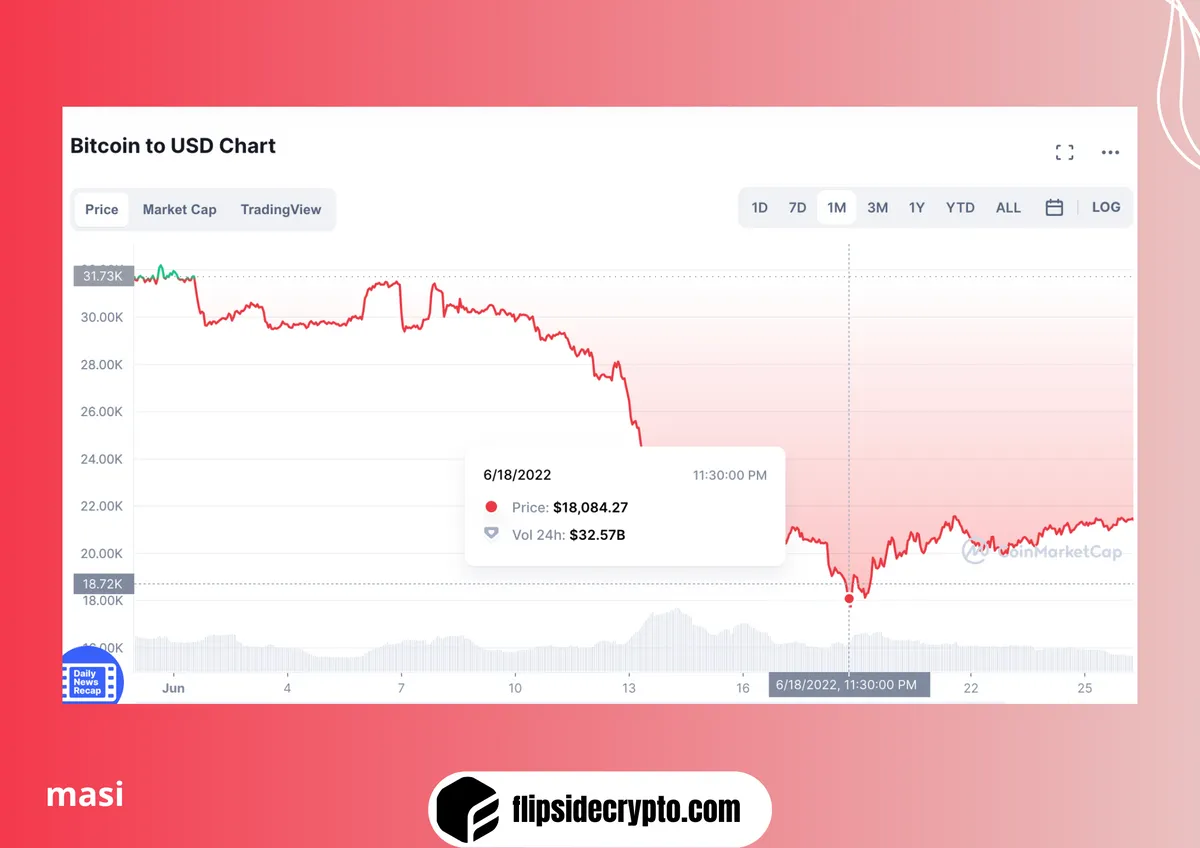
Recent spike: based on the Coin market cap recent spike started on 2022-06-01 when the BTC price was about 31k USD. The day before the value of BTC was around 32k.
The BTC price ranged from 32 to 30 from June 1st till June 7th.
On June 7th the BTC value dropped under 30k.
From June 12th, the BTC value dropped almost every day. Finally, on June 18th, the price of BTC dropped down to 18.084k.
-
Table: ethereum.sushi.ez_swaps , ethereum.sushi.ez_borrowing , ethereum.sushi.ez_lending
-
block_timestamp::date >= '2022-06-01'
-
unique user: count(DISTINCT ORIGIN_FROM_ADDRESS)
-
USD volume: sum(amount_in_usd)
-
Unique borrower: count(DISTINCT borrower)
-
Unique depositer: count(DISTINCT(DEPOSITOR))
This chart shows the number of unique users that made swaps on Sushiswap.
- As I said in the info part, the real spike happened on June 18th.
The number of unique users that had swaps on Sushiswap on this day was 3706 despite the previous day that the number of unique users was 2788 on the previous day.
-
The highest number of unique users was on June 13th. On this day 4413 unique users had swaps on Sushiswap.
-
There is no massive change on on unique users who had swaps during the recent spike.
This chart shows the USD volume of swaps that happened in Sushiswap.
The most volume of swaps on Sushiswap belonged on June 13th.
On this day the price of BTC started at 27637 and dropped to 22.82k at the end of the day.
This price change, made the volume of swaps increase on Sushiswap.
This chart shows the number of unique users who borrow on Sushiswap.
The most unique users on this activity were on June 11th and June 13th.
These days the total number of users who borrowed on Sushiswap was 5.
The volume of borrowing on Sushiswap was the most on June 1st.
On this day the volume of assets that had borrowed on Sushiswap was 105k.
This chart shows the number of unique users that deposited their assets.
The number of unique users was the most from June 16th till June 18th.
On these days, 3 users deposited their assets.
The most volume of deposit activity on Sushiswap during the latest spike was belonged to June 27th.
On this day the USD volume of deposited activity was 1.21 million USD.