Gas fee individualized analysis
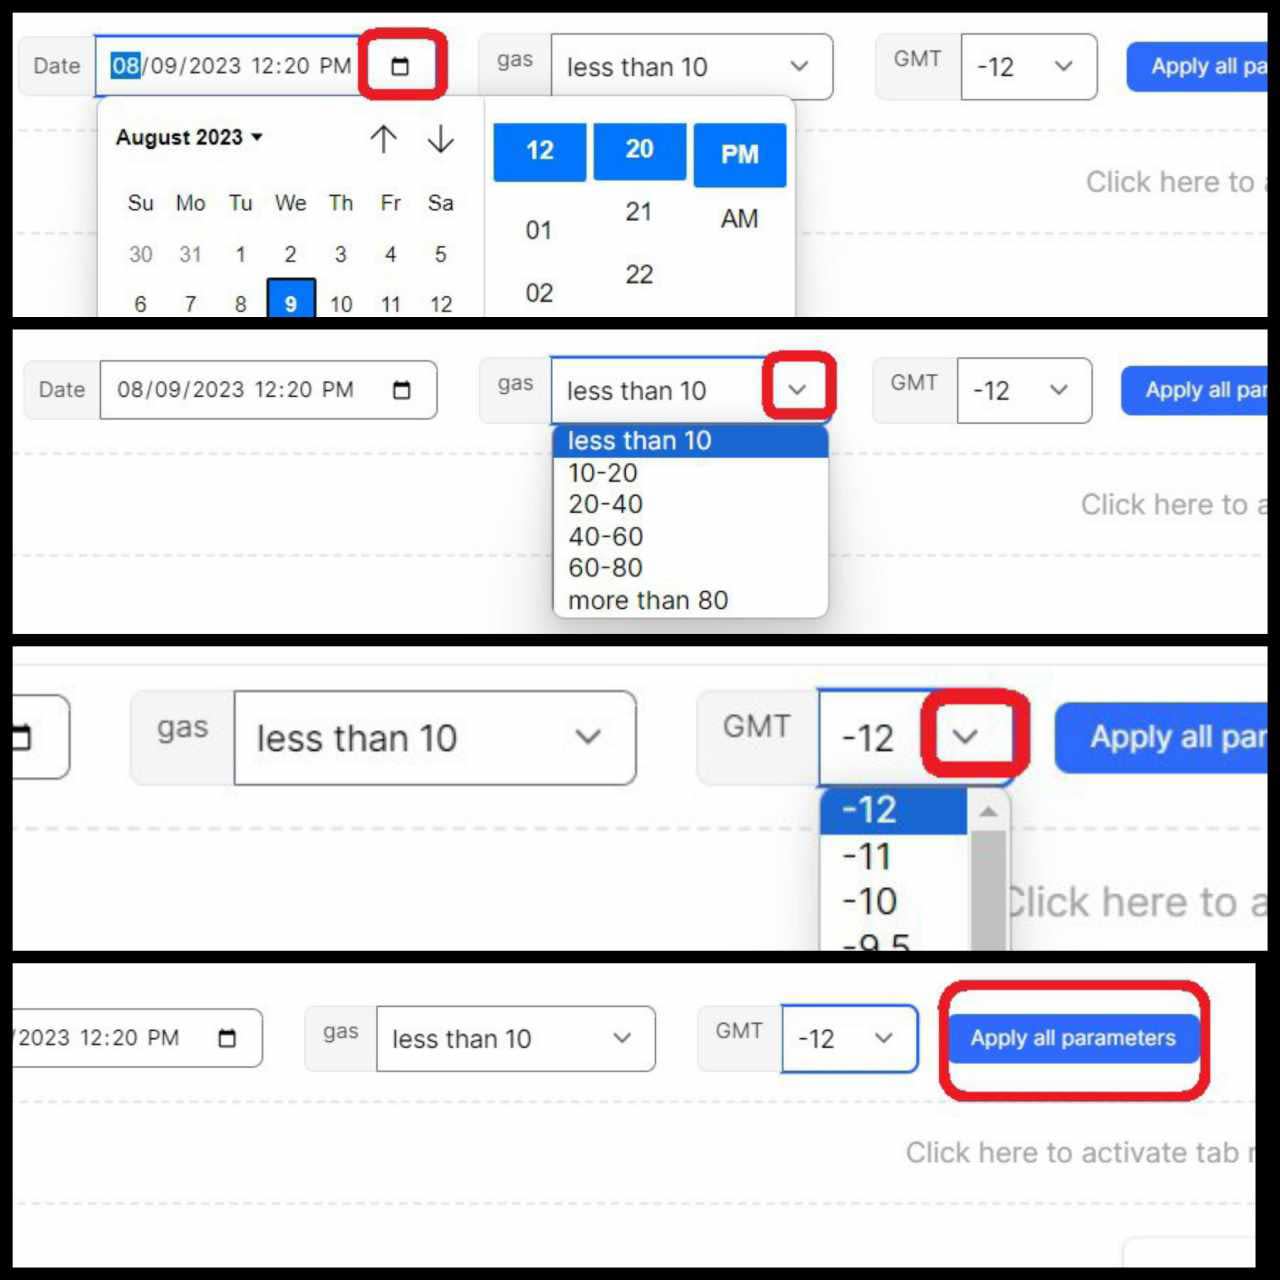
Have a deep analysis of ETH gas fee based of time period, gas range, and local time you select!
Loading...
Loading...
Loading...
Loading...
Overview of ETH gas
ETH gas analysis (selected period)
Loading...
ETH gas analysis (different hours of a day/In your local time)
"Selected Gas" in "Selested Period" in "Local Time"
Loading...
Loading...
Here you can see the average daily Ethereum gas fee, the minimum gas price, the number of users and the ETH price for the last 365 days.
Here you can see the analysis of the gas price in the time period you selected above
- On scatter chart, when the circles become bigger and higher, it means a higher gas fee and vice versa.
- In the tables below, you can see the total hours in which the gas fee was in a certain range you selected and get an analysis of the period you selected based on its gas condition.
Loading...
Loading...
Here you can see how a certain gas price range is distributed during a day in your local time
- You can use it to manage your transaction time
- The donut chart shows the three hours in a day when your selected gas fee is most common
- The bar chart shows the distribution of your selected gas fee in a day
Note: all of these analyses are based on the period you selected first
This dashboard is made by Mrfti using FlipsideCrypto database
You can find me for more alpha on my social medias:
- X (Twitter): https://twitter.com/Mrfti_plus
- Discord: mrfti
- Warpast: https://warpcast.com/mrfti
- Lenster: https://lenster.xyz/u/mrfti
❤️❤️❤️