Flash Bounty: An Odyssey of Congestion
Analyze network congestion on Arbitrum and connect it to the recent Odyssey marketing event.
Introduction
The Odyssey has begun just over a week ago, on the 21st of June 2022. In this dashboard, I will investigate how many users it has attracted to Arbitrum and how much ETH they have bridged into the network thanks to this marketing event.
What is Odyssey?
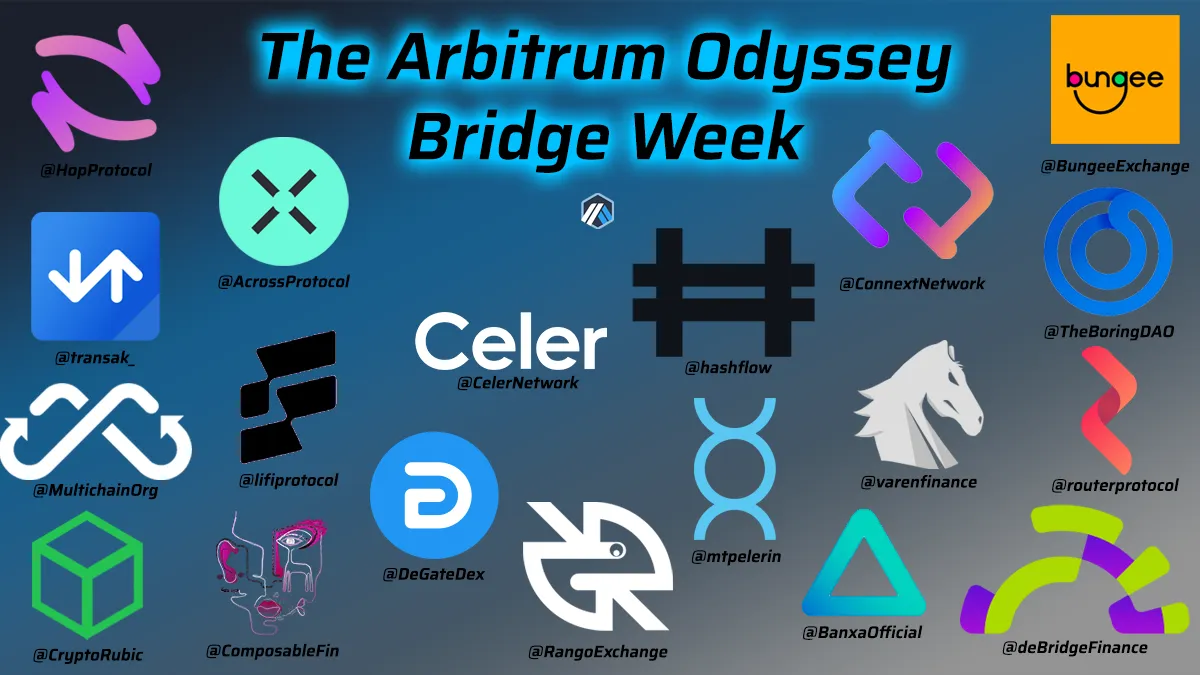
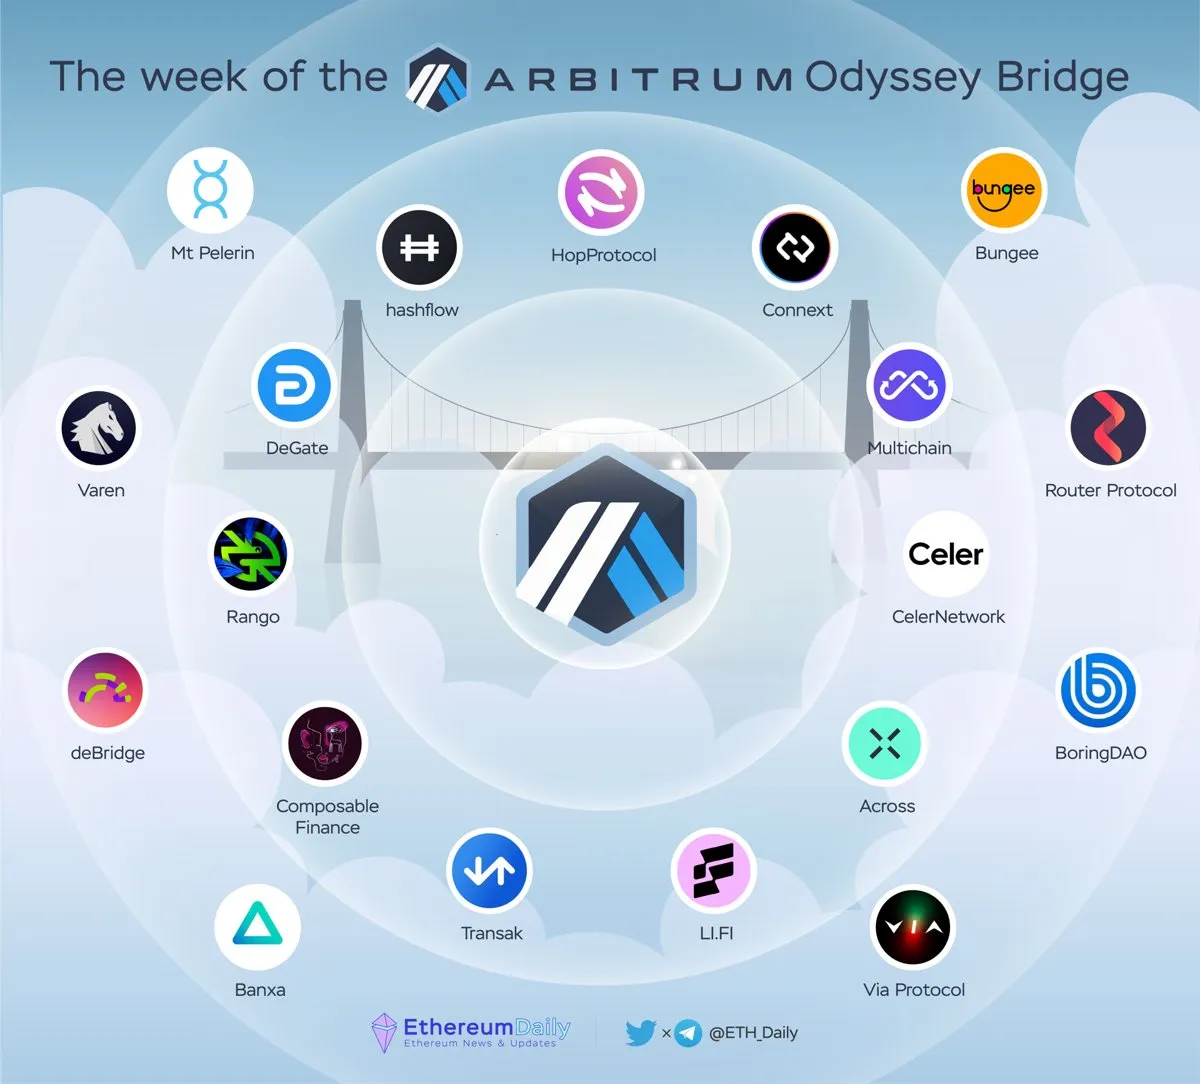
Firstly, let's look into what could attract users to Arbitrum by investigating what Odyssey has on offer (source).

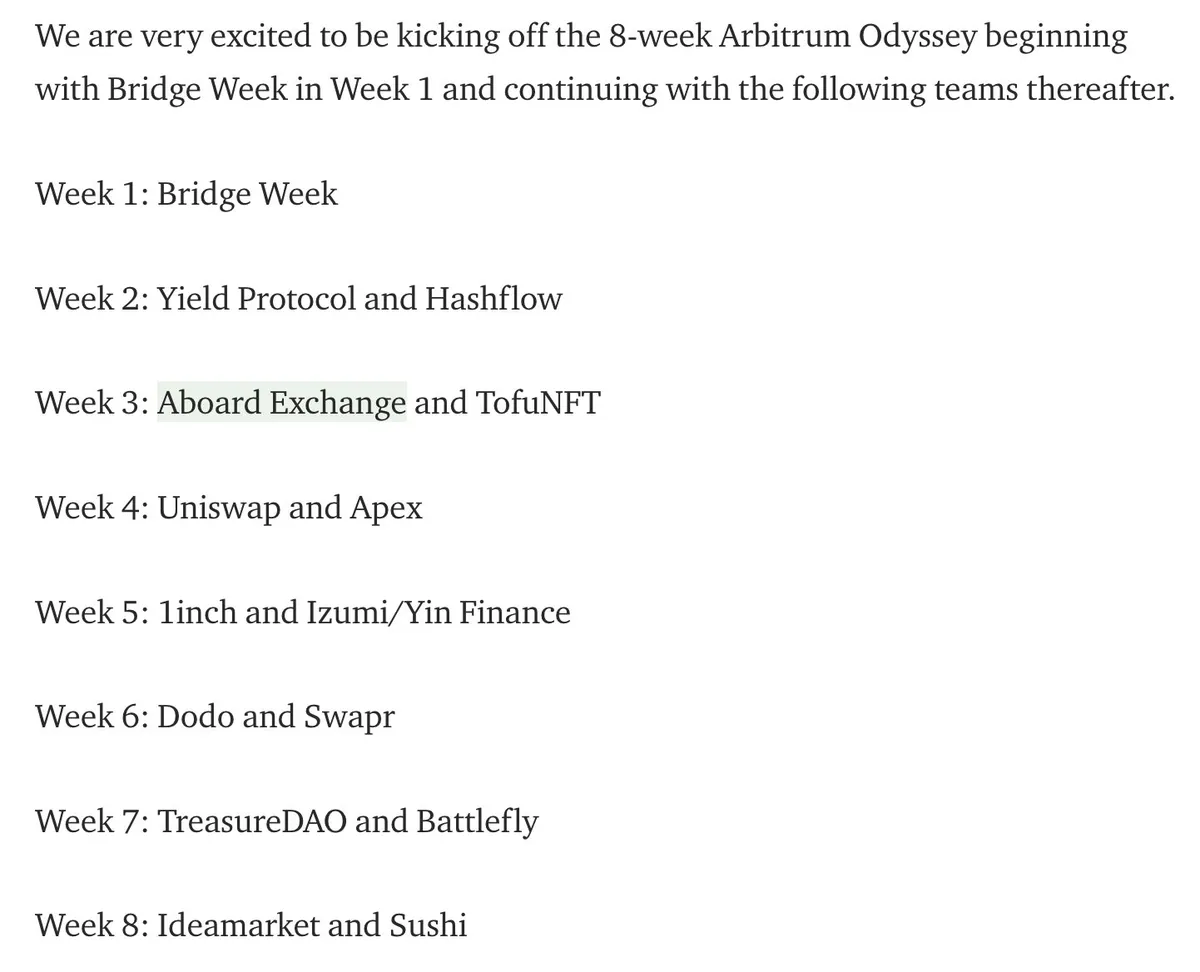
So far, only the first week has fully finished, and at the time of writing, we have just kicked into the second week of the Odyssey. As the goal of the first week was to get as many users to bridge their assets into Arbitrum, using several different bridges, such as for example the Hop Bridge, this analysis will focus mainly on the amount incoming to Arbitrum from those bridges.
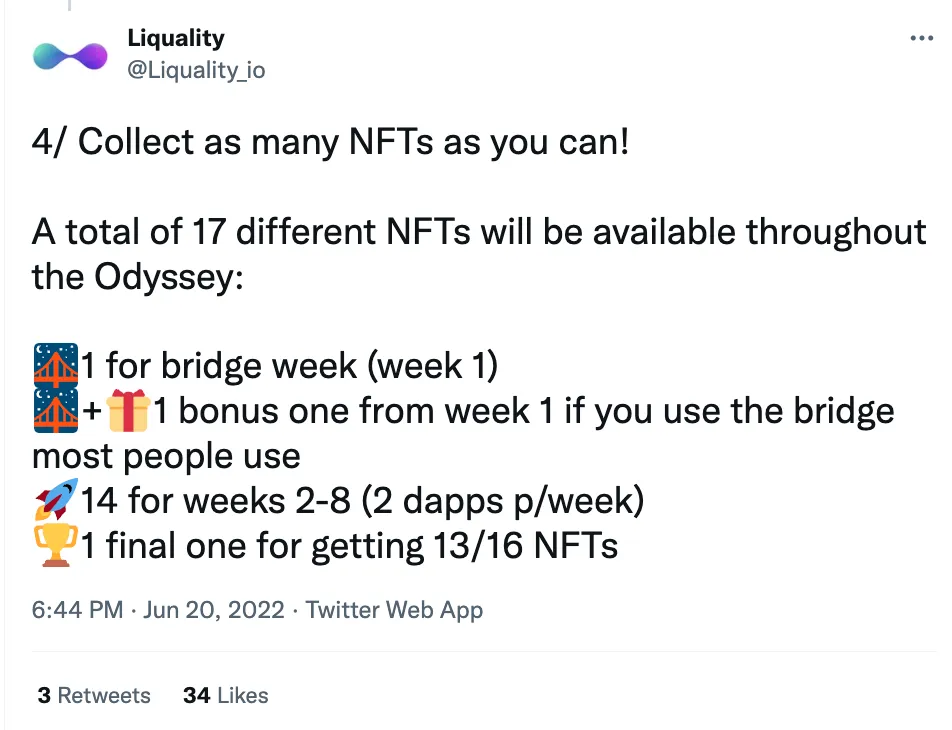
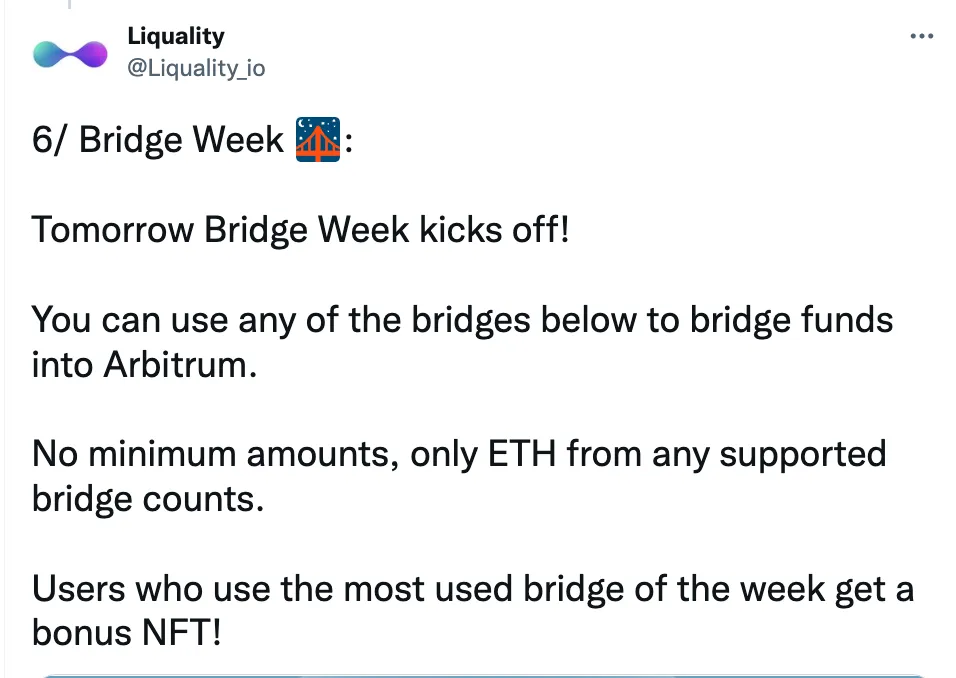
The focus emphasised by the Odyssey's marketing team is on having a competition between bridges - users who transfer their assets using the most used bridge will receive an extra NFT. Having this kind of competition creates even more attraction to the event, as everyone wants to be the 'winner'!
The Odyssey began on the 21st of June - here we can see that there has been a slight increase in daily users on that day, however, it is not a big increase (from 1214 to 1453 users). What is interesting is that the numbers start to rise a bit later, namely around the 23rd of June. We can see a big number of incoming users on the 22nd, with 2808 users bridging into Arbitrum, followed by a lot of money inflowing on the 26th of June - almost 5k ETH has been bridged! What this makes me conclude is that the interest didn't spark exactly when Odyssey launched, but it took users some time to get acquainted with the event and bridge their assets only a few days after its start.
Arbitrum TVL
A successful marketing event should increase the network's TVL significantly. By looking at the data from DefiLlama let's investigate whether this is the case for Odyssey.
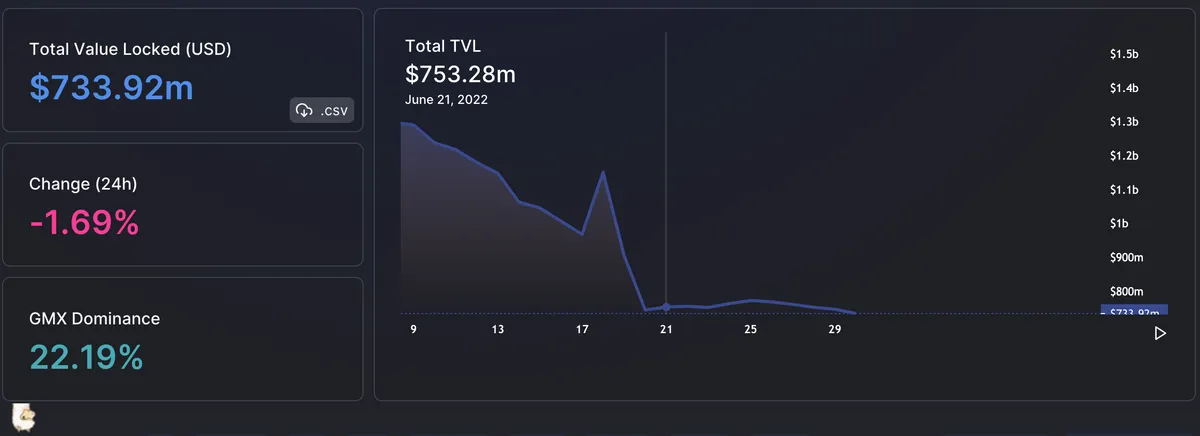
Interestingly, as we can see, the TVL increased before the event launched, and has decreased rapidly during the beginning of Odyssey. The TVL has decreased from the local peak ($1.15B on June 18th) to $753k on the 21st when Odyssey began - which doesn't make me think that the event attracted many users to Arbiturm.
Back to the Bridges
Let's go a step back and look at which bridge was the winner, in terms of the amount of ETH bridged into Arbitrum (source).
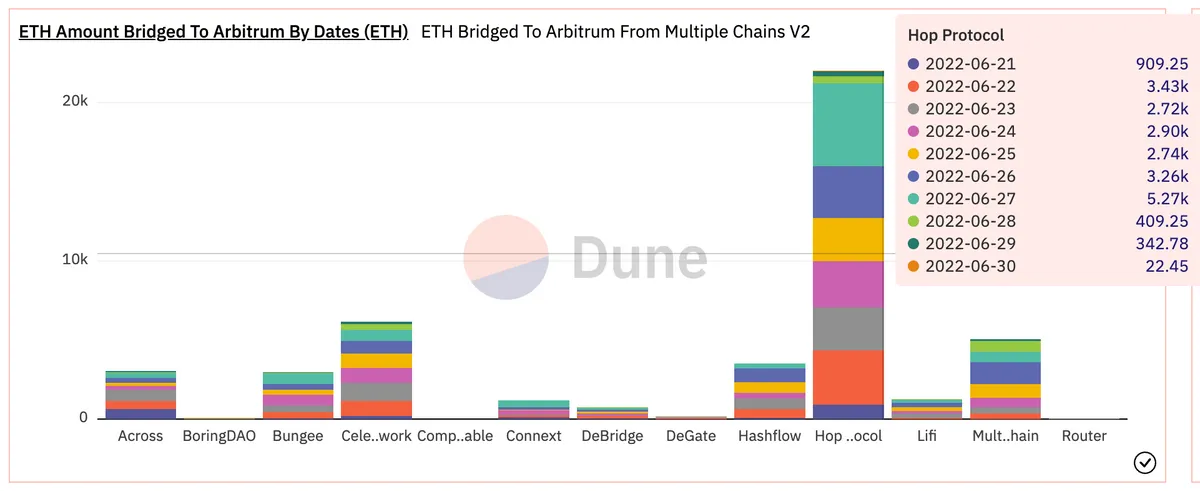
Hop is definitely a winner here, we can see its vast dominance over other bridges. I have also included the dates sorted by the volume of ETH bridged, and we can see that the most ETH that was bridged on Hop was on the 27th of June - which would be in the last days of the first week of Odyssey. Let's look at Hop bridge on its own on a daily basis, to see how the chart will look like.
The problem that I have faced here is that these are all of the transactions made on Hop in the past two weeks, and not just the bridging events to Arbitrum. It seems impossible to me to get this data from the Flipside tables, as there are no labels for the events, and hence no way to filter out the Arbitrum bridging events. However, we can see some overlap between this chart and the graph from Dune - we can see the biggest number of unique wallets briding on Hop on the 27th of June, which agrees with the biggest amount of ETH bridged (from Dune's chart).
Conclusion
This dashboard analysed the congestion on Arbitrum in the past two weeks in order to assess how successful the marketing aspect of the Odyssey event was. We have seen that there definitely has been an increase in briding events since the 21st of June, as well as an increase of unique wallets bringing in assets into Arbitrum and the volume of ETH inflowing into Arbitrum.