Free Square
Q101. This week we want to try something new. We want you to essentially write your own bounty question and answer it yourself. Pick any topic in THORChain that you find relevant and interesting and analyze it.
Introduction
For this dashboard, I have decided to look into how the Liquidity Pools on ThorChain have been doing in the past 120 days. I will investigate the TVL of each pool and how it evolved in the past few months. I will also look at the percentage taken by each liquidity pool compared to the rest of the pools on the ThorChain ecosystem. Lastly, I will look into the top 5 pools based on the imbalance they hold.
Overall Picture
Firstly, let's have a look at how ThorChain is doing overall. The source for these graphs is the one and only DefiLlama.
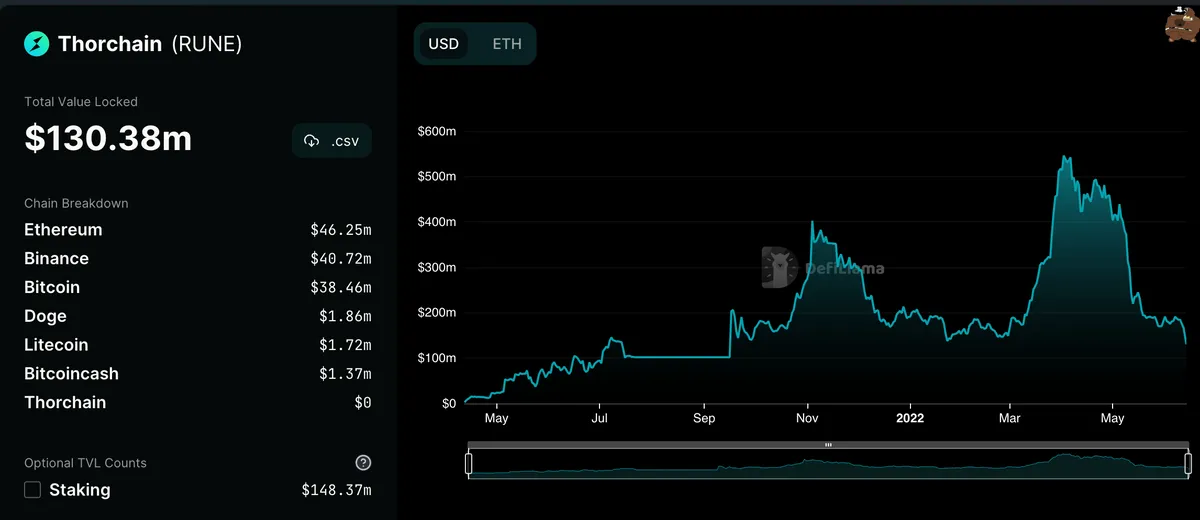
As we can see, the TVL for ThorChain is not looking that good - after several spikes, the value is back down again at 130M dollars. From personal insight, ThorChain provides users with a variety of different pools which are not as easily accessible on other chains, and for that reason, I am quite disappointed that the TVL is on a downward trend. However, one has to keep in mind how the rest of the market is looking like - I am hopeful that once the bear market is over, ThorChain will pick up again!
Let's now analyse the liquidity pools available on ThorChain in order to see which ones have been the most popular amongst users in the past 120 days...
ThorChain and its different Liquidity Pools
Overall, we can see that the bear market has definitely scared a lot of users and that the total liquidity on ThorChain has massively decreased since about the middle of April. Another insight we can get by analysing this graph is that the top 3 pools are still supported by a lot of users even now, given the bear market. For example, on the 8th of June, the liquidity in the BTC-BTC pool stood at almost $20M, whereas in the ETH-ETH pool there was just over $10M. This is a significant drop comparing it to an earlier date, such as April 1st, where over $58M was locked in the BTC-BTC pool, however, it seems that not all users are panicking and removing their liquidity now - I'm happy to see that at least some proportion of that $58M is still in the same pool now.
This chart shows all of the liquidity pools present within the ThorChain ecosystem. As we can see, the most popular is the BTC-BTC pool, followed by ETH-ETH pool and BNB-BUSD pool. Those results are quite standard, I'm not surprised to see that users are supporting the most popular assets as well as stablecoins.
One of the interesting aspects here is that there is still a lot of money locked in the TERRA-LUNA pool, probably due to the fact that all Terra-related transactions have been disabled on ThorChain ever since the crash happened. It's quite sad to see that over $2M is frozen, but in theory, all of that UST is worthless now, it remains on ThorChain as a sour memory...
Let's now look at the daily chart to see how and when users were providing liquidity to each pool.
I thought that it will also be insightful to show an area graph that is normalized, which shows the same data as the previous chart, but here we can see more clearly which pool was the most popular amongst users on a daily basis.
Lastly, as the final piece of analysis, here we can see which pools have the most imbalance at the time of writing. The first pool with the most imbalance is BTC-BTC - it makes sense, as it is the most popular pool in general with the biggest amount of money locked.
Conclusion
This dashboard has explored the variety of pools present within the ThorChain ecosystem. I have looked at how much money is locked in each pool and how they rank against each other. I was quite surprised to see how much money is locked in the Terra pools - however as I mentioned above, this money is pretty much worth nothing now. I have also looked at the daily contribution of liquidity to each pool, and finally explored any pool imbalances.
Lastly, I must say that I really enjoyed being able to pick what to write in this dashboard, i.e, being given the freedom of choosing the topic that sounded the most interesting to me. I hope there will be more bounties like this in the future!