Introduction
It is very important to evaluate the efficiency of computing systems in order to improve their performance. In the face of a high number of users and a large number of transactions, the systems show their processing capability. In order for a computing system to be scalable, it is important for it to be able to perform at a high rate of throughput, which is the most important requirement. The scalability of blockchains is also a very important aspect of them. It is the purpose of this dashboard to measure the throughput of the Flow blockchain and compare it with the throughput of other layer 1 blockchains. As a means of measuring throughput, we measure the important metric of transactions per minute (TPM) as it is one of the most important metrics. As another important measure for blockchain scalability with Flow, we also measure and analyze the failure rate of transactions. The analysis examines the types of different transactions and how they affect the TPM over time, as well as how the volume of transactions affects the TPM over time.
Average TPM of Flow
In this section, we have reported TPM flow at a glance in three different time periods. In the first half of this year, Flow was able to process an average of 241 successful transactions per minute. This amount has improved significantly in the second half of this year and has more than doubled. In the second half of this year, Flow has processed 551 transactions on average. This amount has become even better in the last month and has reached 557 transactions.
TPM Comparison with Other L1 Blockchains
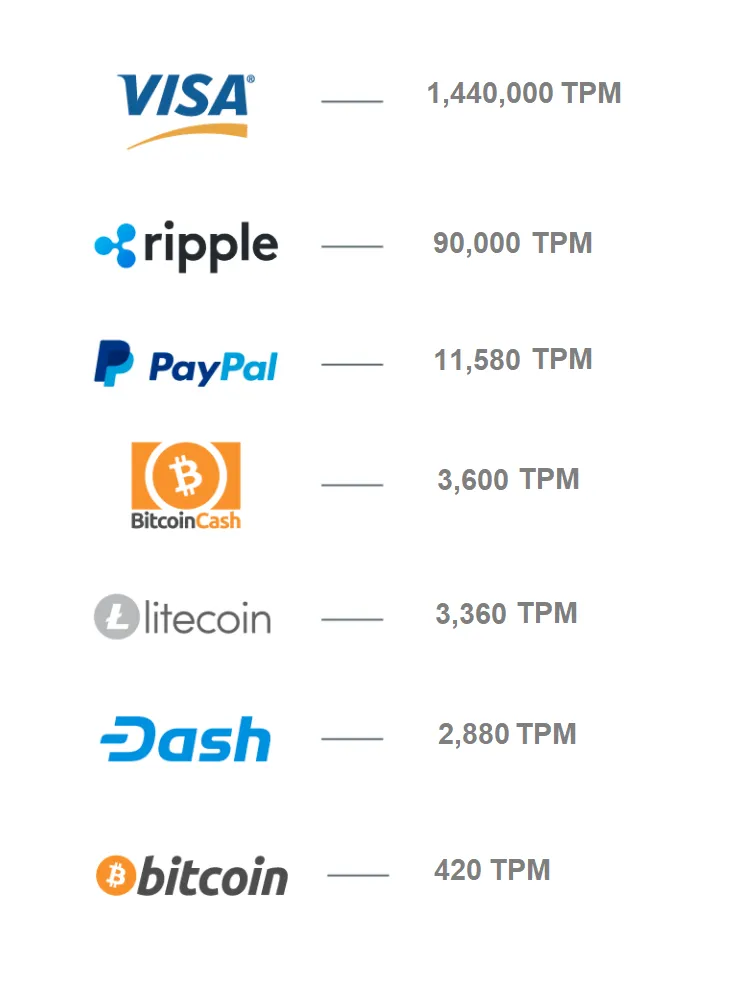
In the following, we provide a comparison with other layer 1 blockchains to measure the efficiency of Flow compared to them. The graphs below show the average number of transactions per minute for Flow and other blockchains in the three mentioned time periods.
Long-Term TPM Trend
In this section, we present the long-term changes of TPM in the first layer blockchains. In the graphs below, the amount of TPM during the last year is drawn in the weekly time frame. Also, the minimum value of TPM and its maximum value are depicted in the graph on the right, which helps us to understand the range of TPM values over time.
Successful and Failed Transactions
In the first step, we separate successful and failed transactions. The first chart shows the number of successful transactions and the number of failed transactions over time on a weekly time frame. The second graph plots the normalized number of successful and failed transactions. Finally, the third graph depicts the transaction failure rate metric over time for Flow.
Observations
- According to the time chart of last year, it can be said that there is no significant correlation between the volume of transactions and the amount of TPM. The correlation value between volume and TPM is 0.2, which is a low value and shows a very low correlation. The negativity of this value indicates an inverse correlation, which means that the decrease of one value leads to the increase of the other value and vice versa.
Failure Rate Comparison to Other L1 Blockchains
In this section, we calculate the transaction failure rate metric for other layer 1 blockchains. The chart on the left plots the failure rate over time on a weekly time frame. The graph on the left depicts the overall average value for all blockchains.
What is Flow?
Flow is a blockchain platform that originally was designed for gaming purposes, but has expanded since its launch in 2020. The flow blockchain enables fast, low-cost transactions and supports smart contracts. It powers blockchain applications including NBA Top Shot, a non-fungible token (NFT) offering. Flow also has a native cryptocurrency that trades under the symbol FLOW [Ref].
L1 Blockchain
Layer 1 refers to the base infrastructure of a blockchain. Nicknamed “the mainnet,” layer 1 protocols have distinct functionalities such as the ability to process and finalize transactions on its own chain. As the main network within their ecosystem, they define the rules. Layer 1 is the fundamental base network of a blockchain platform. It executes all on-chain transactions and therefore acts as a public ledger’s source of truth [Ref].
Transactions Per Minute (TPM)
In a very generic sense, the term transactions per minute (TPM) refers to the number of atomic actions performed by certain entity per minute. In a more restricted view, the term is usually used by DBMS vendor and user community to refer to the number of database transactions performed per minute. Transactions per second may be used in some systems.
Recently, the term has been used to describe the transaction rate of a cryptocurrency, such as the distributed network running the Bitcoin blockchain. The development of transaction rates capable of scaling to real-world volumes is an important area of research for cryptocurrency technology [Ref].

The chart below shows the amount of TPM over the past year for Flow and other layer 1 blockchains on a weekly time frame.
The average transaction failure rate is presented below. The average failure rate in the first six months of this year, the second six months of this year and the last month has been calculated in the graphs below.
Observations
The frequency distribution of TPM values for Flo shows well that we rarely had a value lower than 150. Also, the highest TPM values were in the range of 150 to 1500 and the values outside this range can be considered as outliers.
Observations
- The three events FeesDeducted, TokensWithdrawn and TokensDeposited can be considered the fastest and probably the most popular events. These three events have the highest amount of TPM equal to 551.
- We have about 733 different types of events, of which about 670 had TPM less than 5. 543 TPM events have equaled 1. A low amount of TPM can indicate the low frequency of the event, or it can indicate the speed of transactions of this event.
Please check out this dashboard on twitter

Observations
- As mentioned earlier, TPS flow has increased significantly in the second half of this year. This issue is not true for other blockchains and almost all of them have experienced TPS drop in the second six months. Only Solana had TPS equal to the first six months in the second half of the year and there was no change in this metric in Solana.
Observations
- The maximum number of TPM shows interesting record breakers. Solana has managed to set a record of more than 48 thousand TPM. In second place, Elgorand reached a record of more than 26 thousand transactions per minute. Flo has recorded 2,622 transactions per minute in its highest record.
- Some blockchains, such as Flow, Avalanche, Osmosis, and Terra, have recorded the lowest TPM equals to 1, which corresponds to times when the network was quiet and there were a low number of transactions in the network.
Observations
- The amount of TPM of Flow fluctuated a lot in the last month and fluctuated from 460 to 765. These TPM changes are due to the variation of network conditions over time. Sometimes the network may be quiet or we may be faced with a burst of transactions. Different hours of the day, different days of the week, as well as external events can affect the density of transactions, which in turn affects the amount of TPM reported.
- TPM changes in Flow have been more volatile than other blockchains. Flow has had more ups and downs.
Observations
- It is well known that TPM Flow has fluctuated a lot. These fluctuations can be clearly seen in the second half of this year.
- Algorand and Avalanche have had a clear decrease in the amount of TPM in the last year.
- Ethereum and Osmosis have experienced stable value over the past year. Terra has also had a stable amount with a history of almost six months.
Observations
- Simultaneously with the increase of TPM in the second half of this year, the failure rate of transactions has also increased from 10% to 11%.
- This amount has been extremely high in the last month. Flow has experienced 25% failure rate in the last month.
- The failure rate has been high in two major events, driving up the average. One on May 23, 2022, which had more than 46%. Another on November 14, 2022, where more than 40% of transactions have failed.
- The impact of the second event that happened in the last month seems to be coming to an end. The rate of transaction failure has decreased in recent days.
Observations
-
Like Flow, Solana has experienced an increase in failure rates in recent weeks. In a week, it has reached more than 47%. This is a high number and it means that in that period of time, almost one out of every two transactions was unsuccessful.
-
In the past, osmosis had a failure rate of 73%. But in recent months, it has stabilized in the range of 10-15%.
-
Ethereum has the lowest failure rate. The average failure rate of Ethereum was around 3%.
-
Overall, among the blockchains that have been reviewed, Ethereum and Olunch have the best failure rate values at 3% and 6%. Next is Flow, which is in third place with an average failure rate of 11%.
-
The highest average failure rate was related to Solana with 23%
\
TPM Over Time
We mentioned the general changes of TPM in the second six months of this year compared to the first six months of this year in the previous section. In this section, we focus on TPM changes over time with less granularity.
TPM at a Glance
Evaluating the efficiency of systems requires the definition of metrics that can be measured. In order to evaluate the efficiency of systems whose main task is to respond online to user transactions, the number of transactions per second or the number of transactions per minute can be a good metric to measure system throughput.
Transaction Success Rate
In order to evaluate the efficiency of blockchains, in addition to TPM, we introduce another metric in this section that can help in understanding the efficiency of these systems. Transaction failure rate can be defined as the ratio of the number of failed transactions to the total number of transactions. This metric is variable over time and can be measured. We measure this metric for Flow below.
TPM Frequency Distribution
The amount of TPM experiences many changes over time. By reporting the average TPM, some important information about this metric is lost. In order to better understand the TPM metric for each blockchain, we present the frequency distribution of TPM values over time for all mentioned blockchains.
TPM by Event Types
Different transactions impose different processing load and thus different execution time on the blockchain. In this section, in order to better understand transactions, we have separated them by event type and presented TPM by event type. As a result, we can identify the events that had an important impact on reducing or increasing TPM.
The Effect of the Volume of Transactions on TPM
In this section, we take a look at the volume of Flow transactions to check its relationship with the amount of TPM. We also investigate the existence of events that have caused a sudden increase in volume and impact on TPM and transaction failure rate.
Volume and TPM Correlation
In this section, we examine the correlation between the volume of transactions and the amount of TPM in the past year. The chart on the left plots the moving average TPM and moving average volume for the past year. The graph on the left has calculated the value of the correlation between the volume of transactions and TPM for the last year.
Observations
- The average value of transfer transactions on Flow was more than 15 million dollars. At times, the volume of transactions has exceeded the average amount. For example, last month, the 7th day of December had a high volume of transactions. It cannot be said that there is a relationship between the volume of transactions and the failure rate of transactions. Also, in the next section, we will do a more detailed investigation on the relationship between the volume of transactions and TPM.