Sushi Pairs on Avalanche and BSC


The expected final result of this SushiSwap bounty is to Create a document that includes all addresses for all Swap pairs and Kashi pairs on BSC and Avalanche for sushi, plus the addresses of the two tokens belonging to each pair.
This paper aims to illustrate methods and workarounds used to reach that goal, and also, we will have some analysis on pools.
Method:
Due to the fact that the databases of BSC and Avalanche is not complete on velocity, the On-Chain approach would not work.
To acquire SushiSwap pools specifications, Sushi Analytics API was used.
BSC API:
AVALANCHE API:
These APIs generate Pools specifications in JSON format. These JSON outputs were then extracted and structured to the desired state with Power Query in Microsoft Excel.
To acquire SushiSwap Kashi Pairs, the HTML sources of Kashi Markets of BSC and Avalanche were used. The Kashi addresses, Assets, and collaterals were extracted from the page's HTML source. Other required information was acquired by combining extracted pools data and cross-checking addresses on each blockchain explorer.
BSC Kashi Markets page:
Avalanche Kashi Markets page:
The Final Result can be accessed from this link:
BSC/Avalanche – Pools/Kashis
Pool Analysis:
With the API that Sushi is provided, I saw an opportunity to have a dashboard of Sushi pools analysis. So, I created a dashboard using Microsoft Power BI.
The dashboard can be accessed from this link:
Sushi Pools Analysis with Power BI
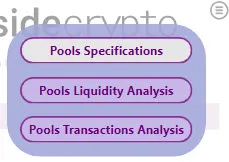
This dashboard has 3 pages: Pools specifications, Pools Liquidity Analysis, and pools transactions analysis

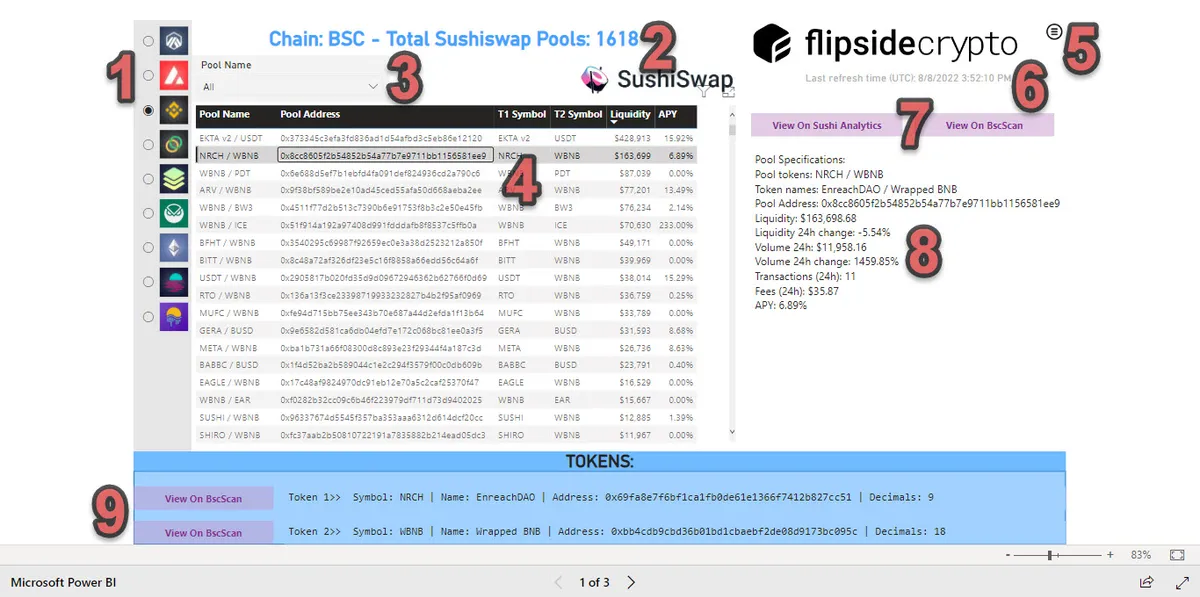
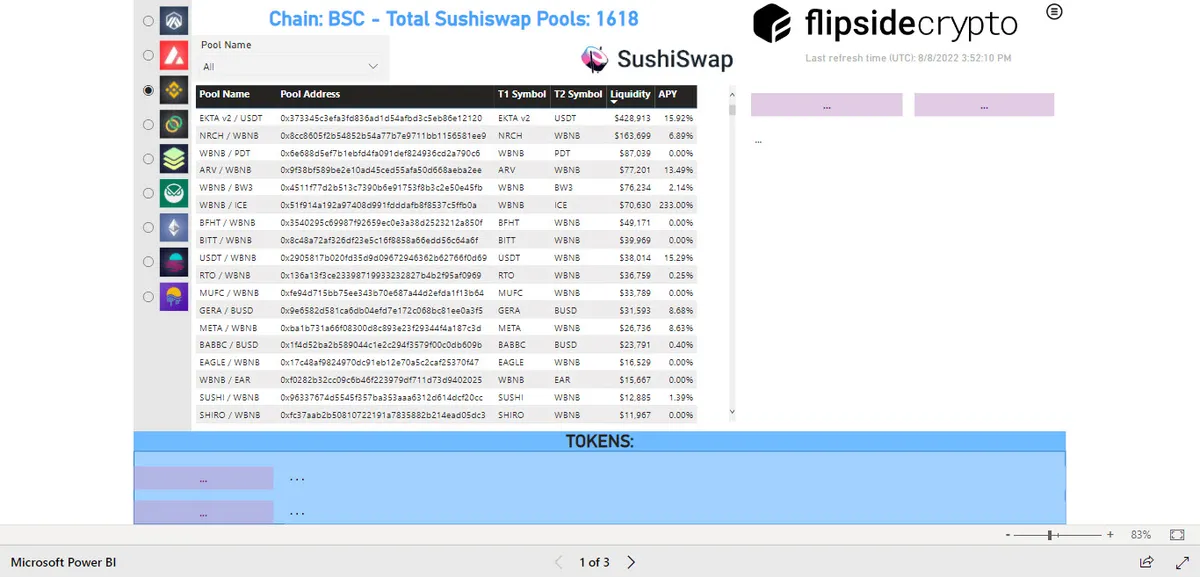
This is the first page of the dashboard:
Introducing elements of the dashboard:
Page1:
- Selecting the chain from available chains to see their Sushi pools.
- Showing selected Blockchain and number of available pools
- Selecting pools by searching pool name and choosing them
- This table shows pool name, pool address, T1 Symbol, T2 Symbol, liquidity and APY of all pools in the selected blockchain.
- This opens Menu to navigate through other pages
- Shows last refresh time in UTC.
- When any of pools are selected in 4th element, these two buttons become active and contain a link to show pool specifications on the blockchain explorer and Sushi Analytics.
- More details about the pool
- View Tokens of the selected pool on the blockchain explorer.
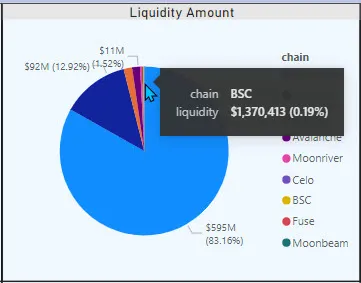
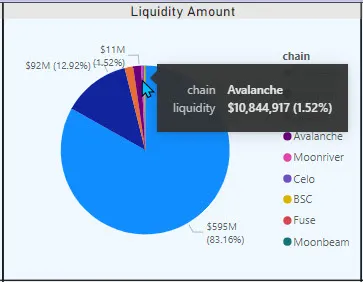
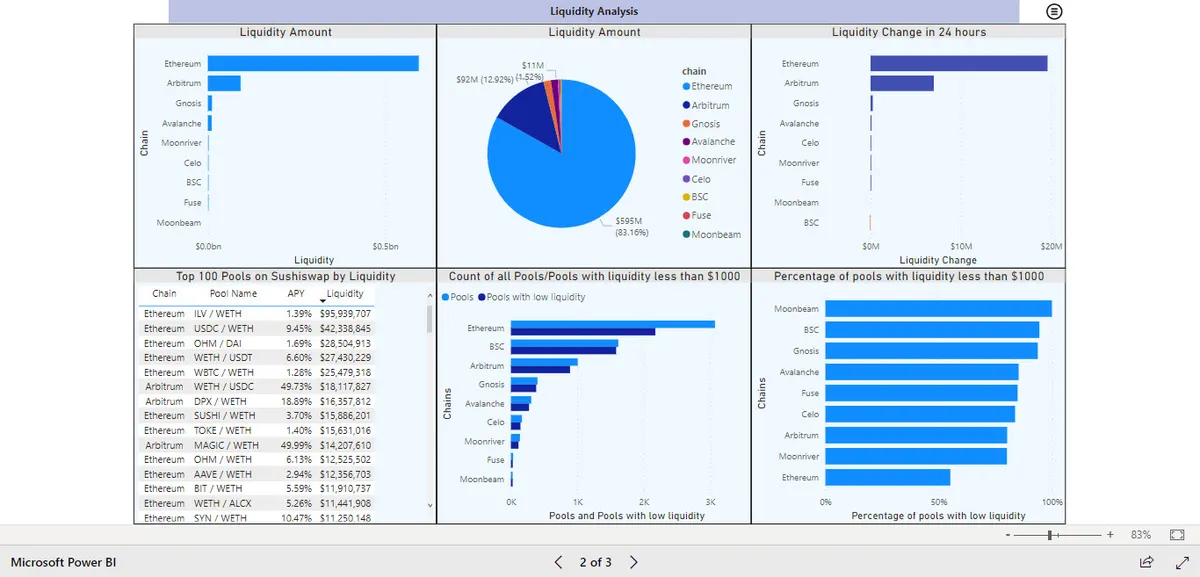
In page two, we have Pools liquidity Analysis:
We can see that BSC with the liquidity of about $1.37M has 0.19% of liquidity among available chains in the dashboard. Avalanche with total liquidity of $10.8M has 1.52% of all liquidities.
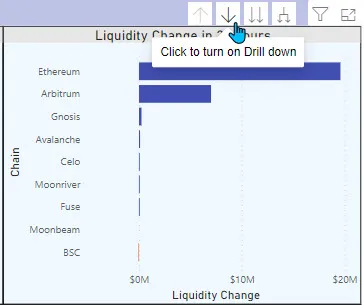

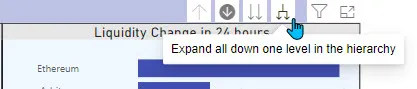
Top 3 charts in this page of dashboard have Drill down Feature. By clicking on the specified icon and then each chain, we can see that parameter for every single pool in that chain
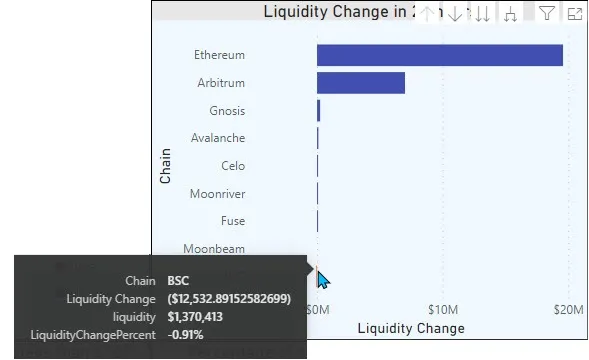
By hovering over each bar, we can see additional info:
For example, Liquidity of BSC decreased by $1,370 in the past 24 hours which means 0.91% of the liquidity decreased.
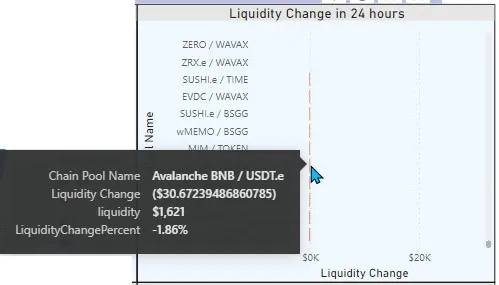
So here, after click on drill down icon and then Avalanche chain and Scrolling down, We can see lowest liquidity changes.
For example, this pool has $1,621 liquidity and in past 24 hours decreased $30 (1.86%)
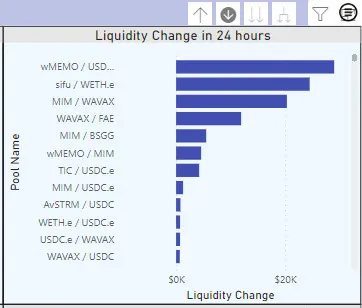
After click on drill down icon and then Avalanche chain, we can see liquidity change for each pool in avalanche in the past 24 hours.
By Clicking on this Icon, we can go back to Chains.
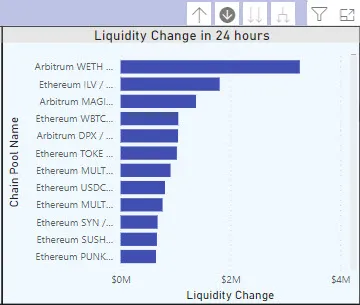
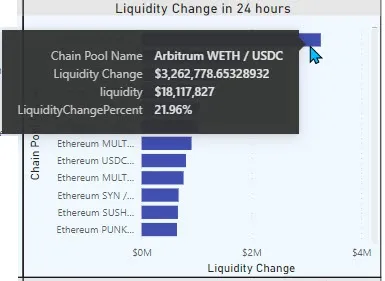
By clicking on this Icon all pools of all chains will show.
- We see that the highest amount of liquidity change is in Arbitrum - WETH/USDC pool.
Top 100 Pools chart shows top 100 sushiswap pools sorted by liquidity amount.
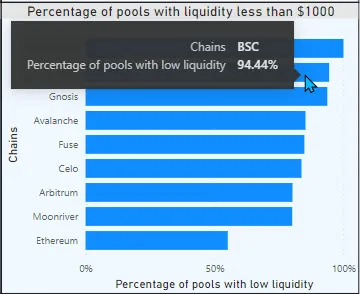
This chart shows that about 95% of pools on BSC have liquidity amount of less than $1000. This percentage for Avalanche is 85.29%.
The 3rd page of the dashboard is Transaction Analysis, The charts are like Liquidity amount and liquidity change charts of the previous page.
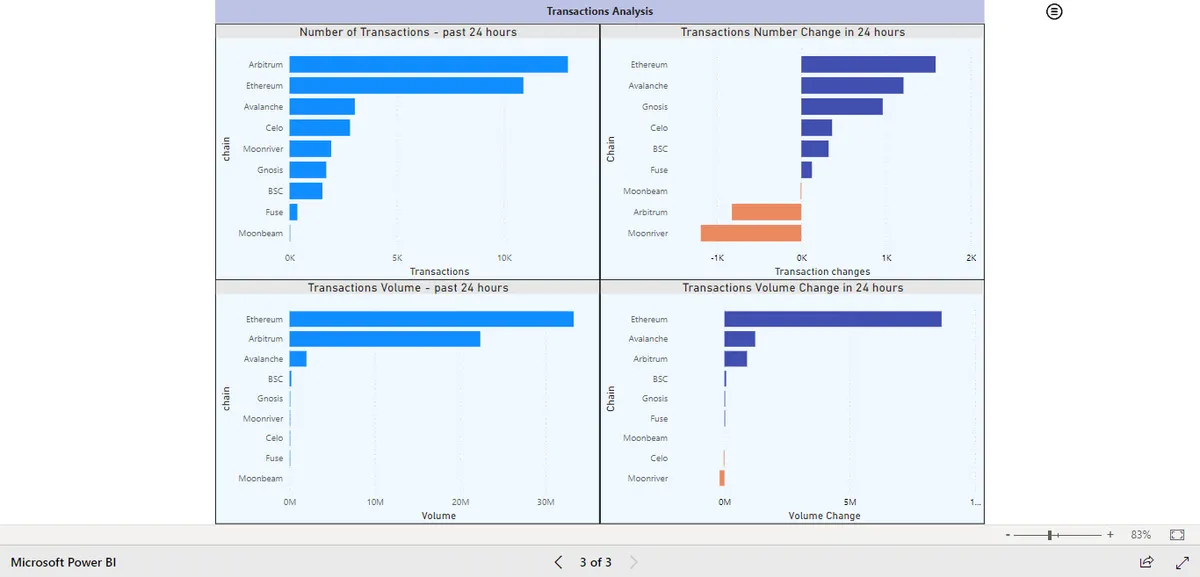
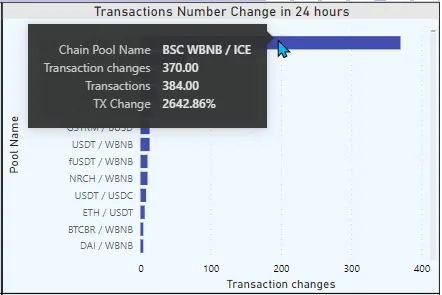
We can see that in the past 24 hours, WBNB/ICE pool has the highest transaction number increase in BSC chain. with 370 increase in transactions, it reaches to 384 transactions which means 2642% increase.
Data Insights from the dashboard (as of this writing) - Among Ethereum, Arbitrum, Gnosis, Avalanche, Moonriver, Celo, BSC, FUSE, and Moonbeam:
- BSC has 1618 Pools and Avalanche has 306 pools on Sushi.
- Ethereum has the highest liquidity amount with about $595M (83.16% of Liquidities among reviewed chains)
- In the past 24 hours, BSC was the only chain that had a decrease in its liquidity. that was mostly because WBNB/META pool that had lost about $38,000 (99.96%) of its liquidation.
- In the past 24 hours, Avalanche and BSC transactions increased by 162% and 26.5%.
- In the past 24 hours ,Avalanche and BSC transactions volume increased by $1,227,214(162%) and $212,000(48%).
Counts = "Chain: " & SELECTEDVALUE(Dim_Chains[chain]) & " - Total Sushiswap Pools: " & Count(Fact_Pools[apy])
Pool Spec = IF(HASONEVALUE(Fact_Pools[Pool Name]),

"Pool Specifications:"  & UNICHAR(10) &
"Pool tokens: " & SELECTEDVALUE(Fact_Pools[Pool Name]) & UNICHAR(10) &
"Token names: " & SELECTEDVALUE(Fact_Pools[T1 Name]) & " / " & SELECTEDVALUE(Fact_Pools[T2 Name]) & UNICHAR(10) &
"Pool Address: " & SELECTEDVALUE(Fact_Pools[Pool Address]) & UNICHAR(10) &
"Liquidity: " & Format(SELECTEDVALUE(Fact_Pools[liquidity]),"currency") & UNICHAR(10) &
"Liquidity 24h change: " & FORMAT([LiquidityChangePercent],"percent") & UNICHAR(10) &
"Volume 24h: " & Format(SELECTEDVALUE(Fact_Pools[volume1d]),"currency") & UNICHAR(10) &
"Volume 24h change: " & Format([VolChange],"percent")  & UNICHAR(10) &
"Transactions (24h): " & SELECTEDVALUE(Fact_Pools[tx1d])  & UNICHAR(10) &
"Fees (24h): " & Format(SELECTEDVALUE(Fact_Pools[fees1d]),"Currency")  & UNICHAR(10) &
"APY: " & Format(SELECTEDVALUE(Fact_Pools[apy]),"percent")
,"...")
PoolScan = IF(HASONEVALUE(Fact_Pools[Pool Name]),
SELECTEDVALUE(Dim_Chains[Scanurl]) & SELECTEDVALUE(Fact_Pools[Pool Address]),"")
SushiAnalyticsButton = IF(HASONEVALUE(Fact_Pools[Pool Name]),
"View On Sushi Analytics","...")
SushiAnalyticsURL = "https://app.sushi.com/analytics/pools/" & SELECTEDVALUE(Fact_Pools[Pool Address]) & "?chainId=" & SELECTEDVALUE(Dim_Chains[chainid])
Token1 = IF(HASONEVALUE(Fact_Pools[Pool Name]),
"Token 1>>  Symbol: " & SELECTEDVALUE(Fact_Pools[T1 Symbol]) & " | Name: " & SELECTEDVALUE(Fact_Pools[T1 Name])
& " | Address: " & SELECTEDVALUE(Fact_Pools[Token 1 Address])
& " | Decimals: " & SELECTEDVALUE(Fact_Pools[T1 Decimals])
,"...")
Token1Button = IF(HASONEVALUE(Fact_Pools[Pool Name]),
"View On " & SELECTEDVALUE(Dim_Chains[Scanner]),"...")
Token1Scan = IF(HASONEVALUE(Fact_Pools[Pool Name]),
SELECTEDVALUE(Dim_Chains[Scanurl]) & SELECTEDVALUE(Fact_Pools[Token 1 Address]),"")
Token2 = IF(HASONEVALUE(Fact_Pools[Pool Name]),
"Token 2>>  Symbol: " & SELECTEDVALUE(Fact_Pools[T2 Symbol]) & " | Name: " & SELECTEDVALUE(Fact_Pools[T2 Name])
& " | Address: " & SELECTEDVALUE(Fact_Pools[Token 2 Address])
& " | Decimals: " & SELECTEDVALUE(Fact_Pools[T2 Decimals])
,"...")
Token2Scan = IF(HASONEVALUE(Fact_Pools[Pool Name]),
SELECTEDVALUE(Dim_Chains[Scanurl]) & SELECTEDVALUE(Fact_Pools[Token 2 Address]),"")
Count_lowliquidity = Calculate(Count(Fact_Pools[Pool Name]),(Fact_Pools[liquidity] < 1000) )
Liquidity Change percent in past 24 hours = SUM(Fact_Pools[liquidity1dChangePercent])/100
LiquidityChangePercent = IF(
    (SUM(Fact_Pools[liquidity])-SUM(Fact_Pools[liquidity1dChange]))=0,1,
    (SUM(Fact_Pools[liquidity1dChange])/(SUM(Fact_Pools[liquidity])-SUM(Fact_Pools[liquidity1dChange]))))
Low Liquidity pools = Calculate(Count(Fact_Pools[Pool Name]),(Fact_Pools[liquidity] < 100) ) / Count(Fact_Pools[Pool Name])
txchange = SUM('Fact_Pools'[tx1d]) - SUM('Fact_Pools'[tx2dm])
TXcountChange = IF(SUM(Fact_Pools[tx2dm])=0,0,
(SUM('Fact_Pools'[tx1d]) - SUM(Fact_Pools[tx2dm])) / SUM(Fact_Pools[tx2dm])
)
VolChange = IF(
    OR(
        (SUM(Fact_Pools[volume1d])-SUM(Fact_Pools[volume1dChange]))=0,(SUM(Fact_Pools[volume1d])
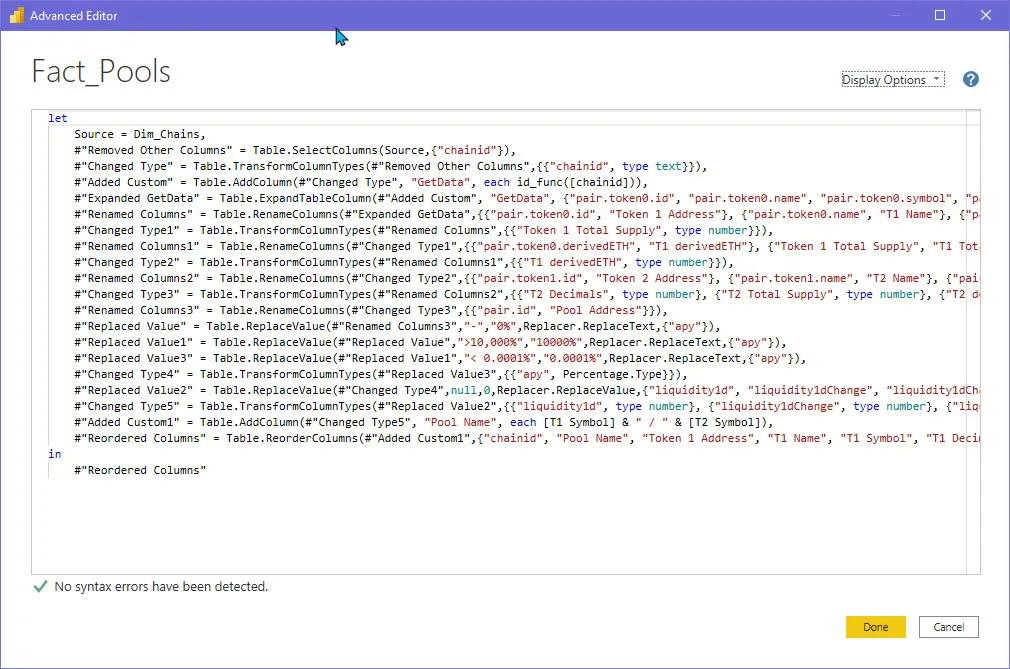
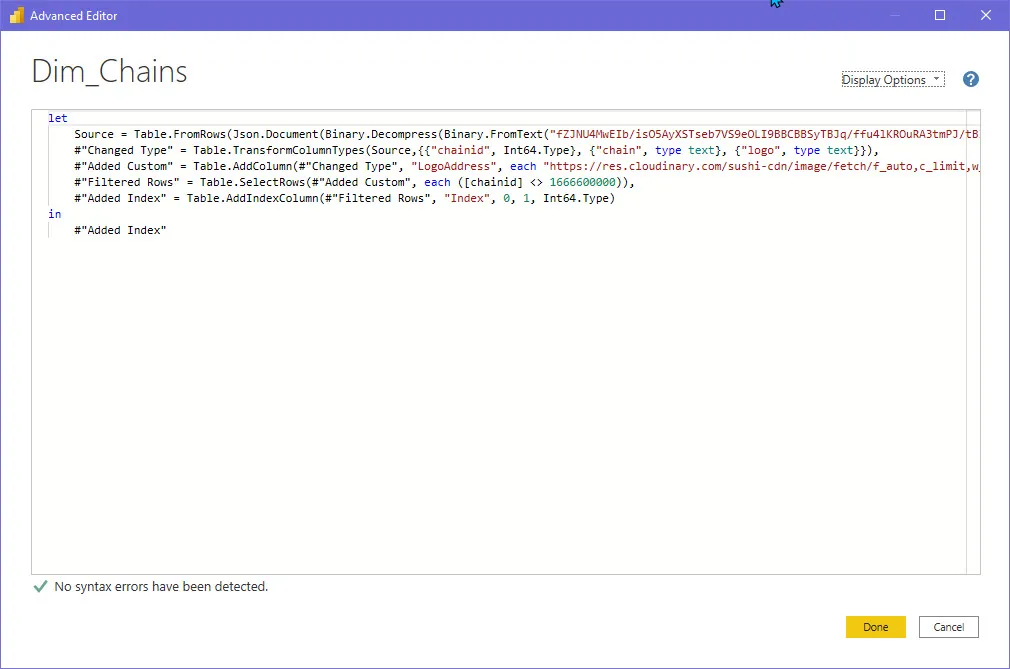
Queries:
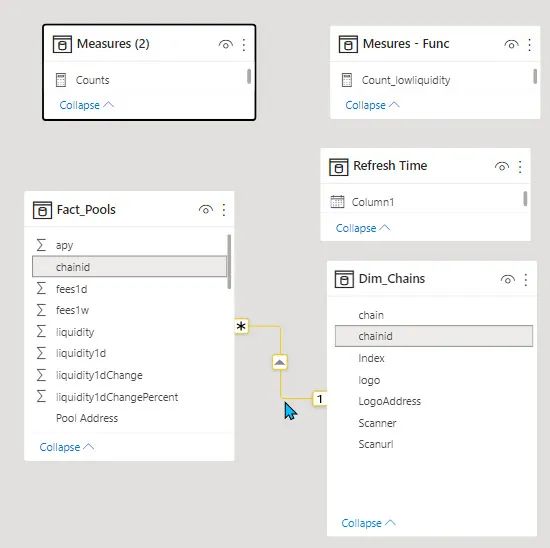
Data Model:
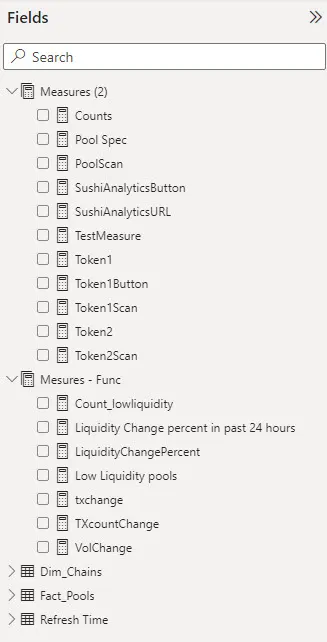
Measures:
This Power BI dashboard can be updated on a minimum frequency of 6 hours. but auto-update is suspended for now until after the review.
Contact Me:
Twitter @MetaCrypto_Geek