Flipside World Cup Round of 16: NFT Sales Comparison By Chain
#Algorand #Ethereum #Flow #Near #Solana #NFTS #MARKETPLACES
Summary
- Ethereum is by far the blockchain with most NFT Activity, it has the bigger numbers for everything.
- Daily the NFT Activity is by far bigger than the rest, it can challenge all of the rest blockchains at the same time and still won.
- Solana is in second place, in this blockchain the number of sales can challenge Ethereum, but aside for the number of sales, the $USD Volume, isn’t enough to reach Ethereum.
- Still Solana Have a lot of active buyers in the NFT Marketplace.
- Flow is in third place, thanks to their collections and the sports fan, the volume of sales in this blockchain is notable, there are some aspects where flow is really close to Solana, but in most of them, there is still a high difference in numbers with Solana.
- Having the NFL/NBA Collections and a lot of different NFT collections helps the NFT Sales activity in Flow.
- Algorand is in 4th place, although it have the Fifa Collection and some interesting NFT proyects, Algorand numbers are really low in comparison with the rest.
- I hope that in this Fifa worold championship can raise good NFT Sales numbers
- Near is in last place, NFT activity in this blockchain seems to drop a lot in this year, it doesn’t help that there isn’t enough marketplaces or interesting partnership to promote NFT Activity, so the stats of Near in comparison with Algorand are really low!.
🏆 ⚽ Flipside World Cup Round of 16: NFT Sales Comparison By Chain ⚽🏆
The World cup of bounties returns again, this time with a new challenge, track the NFT sales across multiple chains.
Non-Funglible Token (NFT) - Definition by Wikipedia
> “A NFT is a unique digital identifier that cannot be copied, substitued, or subdivided, that is recorded in a blockchain, and that is used to certify authenticity and ownership” - Merriam Webster
The ownership of an NFT is recorded in the blockchain and can be transferred by the owner, allowing NFTs to be sold and traded, the places where users trade NFTs is called a NFT Marketplace.
> “NFTs can be created by anybody, and require few or no coding skills to create” - eduwab
NFTs typically contain references to digital files such as photos, videos, and audio. Because NFTs are uniquely identifiable assets, they differ from cryptocurrencies, which are fungible.


My NFT from Flipside - NFT Collection GODMODE

In most cases the $USD volume per NFT is higher than per Sale, but this isn’t the case for Near which doesn’t have too much NFT activity so the numbers are similar.
It’s seems that the average Buyer of Near purchase more NFTs than the rest of blockchains, Flow and Algorand also presents the same trend.


SALES!
The Cumulative Chart are really good to know how the activity is in all blockchains.
If the growth is constant per date you can see that the activity in the blockchain is normal!.
Any abnormal increase must be correlated with an event in the blockchain.
In general Ethereum and Solana have the most sales, Flow is the other blockchain easy to see but Algorand and Near are “invisible”.
NFTS!
The main Reason the Text and Charts are in different positions is to draw Attention!.
Hope in that way is easily to look at the charts without being too boring!.
Ethereum cumulative NFTs sold is really high.
Solana in Second place Followed by Flow.
As always Algorand and Near are invisible in the Area chart but it can be seen in the Interactive Chart!.


Methodology
Using Flipside Crypto Data tables, of NFT Marketplaces for each chain.
But using the data and fixes to these tables provided by Yousefi_1994 in their dashboard!.
I reused the code, changing the final select to create my own analysis, but is thanks to their good work, that it was easy to show the data. In general i decided to add All time metrics, put all the info in one dashboard without Chain Aggregation, and use differents queries to improve the charge times of the data.


🔍 Data Analysis🔍
- We can see that during all the time, Algorand NFT Sales can’t reach the sames volumes as their competitors, but there is still an active market for these buyers.
- The Cost of NFTs in Algorand is really low with an Average of $37 per Sale, and a median sale of $9.38.
- Octorand is the Collection with most Sales Volume (1M Aprox)
- Alchemon is the collection most sold


How this Dashboard works?
First we have 2 parameters, Time to choose the time period to analyze the data and Date_Aggregation to see some data by day/week/month.
- First Part of the dashboard - Blockchain Comparison.
- General Metrics - Here we can see total metrics over the time period choose, and the direct comparison between each blockchain
- Metrics by Time - Here we can see metrics by day/week/month, and their direct comparison with each blockchain.
- Cumulative Metrics - Here we can see the same metrics by time before, but with cumulative results and interactive charts + Area charts
- Second Part of the dashboard - Blockchain Analysis. Here you’ll see each one of the 5 blockchain by alphabetical order (Algorand - Ethereum - Flow- Near - Solana) Each one of them will have:
- Total Metrics - Here are the numbers from all the data that flipside has, here the charts are from all the time and isn’t from the time period you choose.
- Metrics by Time - Here are the metrics based in the time period/ date_aggregation parameters.
- Marketplaces Metrics: First are the NFT Sales metrics based by Marketplace
- Collection Metrics: Finally the NFT Sales metrics based by Collection (Only the top 15 named collection by USD Volume are included)
🔍 Data Analysis🔍
- Ethereum metrics are by far the bigger of the blockchains presents.
- Terraforms is the colection with most volume.
- Most of these NFT Collections were really popular during the cryptoboom of 2021.
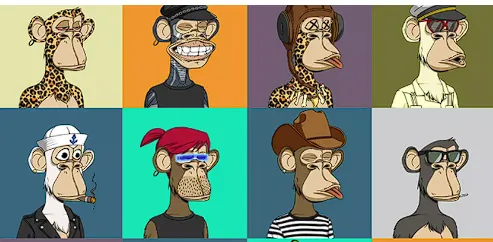
- Cryptopunks to the left and Bored Ape yatch Club to the right are some of the most know NFTs.