Hop in the Pool
#OSMOSIS #ADD_LIQUIDITY #ALL_ASSETS #SINGLE_ASSET
🔮Welcome to the Osmosis Zone🔮
- Osmosis is a Layer-1 Blockchain built on the Cosmos framework, operates a decentralized exchange (DEX) and the $OSMO is the native token which serves as governance and staking for users.
- DEX: A peer-to-peer market where users can buy and sell assets (Crypto-tokens) without giving their private keys to an intermediate.
- Osmosis is a DEX blockchain, and you can see that immediately in their website, the first thing you see when you enter is the option to swap your assets.
🧪The Single Asset LP Button🧪
- This feature was added to Osmosis on December 17, and although the image there is a bit old, the image at your right is how the option works nowadays.
- Providing Liquidity using this option works in the following way:
- The single token you provide, is going to be swapped for the others tokens in that pool, incurring in a swap fee.
- After all the tokens are in the same proportion they’re going to be added to the pool.
- But this isn’t the same as swap the tokens and then added via the “All assets” Option?.
- NO!, it may be the same but there is a crucial difference which is the mitigation of the Pool Ratio.
- When people swap in a Liquidity Pool, the amount of 1 token decreases and the other increases, because of that change the Pool ratio may change, and the value of the tokens in that pool change.
- This may be irrelevant for small swaps, but for large amounts the price change is an important factor.
- So when you swap tokens and then add liquitidy without using this button, the amount needed to provide liquidity may change because of the change in the Pool ratio when you swapped the tokens.
- Using this button prevents these type of changes when swapping and adding liquidity, in the end the Pool ratio will change (because you were swapping and adding liquidity), but you can mitigate the change in the pool ratio between these 2 actions with that button.
- And you can half the transaction fees , because the action is going to count as 1 transaction only and save time!.
Clarifications
-
Because the goal is to see the difference between providing liquidity with all assets vs single assets, the data is going to start from December 18 2021, one day after when that option went public on Osmosis.
\
-
I’ll Analyze only Successful Transactions.
\
-
The main goal of this dashboard is show the difference between these 2 options:
\
-
Single Asset: Adding One asset to the Liquidity Pool, automatically swap for equal amounts and then adding these tokens to the Pool.
\
-
All Assets: Adding Both Assets to the Liquidity Pool, you already have the needed amount for the two assets or you’re swapping by yourself
\
-
-
And know if the Osmosis Environment uses both options or only one.
🔍 Data Analysis🔍
Single Asset Button, is a good option and we can see that in transaction activity where the difference is the lowest with 41.1% over 58.9%.
Still most users prefers the All assets option with a total of 61.6% Users using that option over the Single Asset 38.4%.
The big difference can be seen in the USD Volume, with only a 19.4% of the total USD Volume provide to liquidity with the single asset option, versus the 80.6% for the All assets Option.
Users using the Single Option provide an average of $260 USD in liquidity vs the Users using the All assets option wich provide an average of $454 USD in liquidity
Methodology
Using Flipside data tables from Osmosis.
- osmosis.core.fact_liquidity_provider_actions: To get all the info about “Add liquidity” transactions, that means (users, transactions, amount).
- osmosis.core.dim_prices: To get the tokens $USD price.
I tried to do a brief analysis, with the goal of show the difference between these 2 options, without overchaging the dashboard with information.
I used Alik110 method to differentiate, these actions, but changing the time period to only count when the Single Asset Option appear, so we can have a better comparison between these 2.
Flipside Question
Analyze how users join pools on Osmosis.
Do they dive in headfirst (add both assets; joinpool) or do they wade in carefully (singleside; join swap extern amount in). Also analyze how deep the pool is (typical swap size in token and USD for both activities).
BONUS: Post your dashboard on Twitter and tag @flipsidecrypto and any relevant accounts!
Summary
- Single Asset Option is used by an important amount of users, but still the prefered choice is the All assets Option.
- Daily, the amount of users and transactions for both options are similar, with all assets being higher than single asset.
- The same can apply to users and transactions by $USD amount, they’re pretty similar but all assets number is higher.
- $USD Volume is where the differences can be spotted, during the cryptoboom most $USD Volume comes from All assets action, but in the later months of 2022 is possible to see some days where $USD Amount for single asset option is higher than All Assets.
- It’s seems that most users adding liquidity of $100,000 to $1,000,000 prefer the All assets option over Single Asset.
- in both cases the Liquidity coming from $1,000 to $10,000 amount is the higher in $USD Volume.
- Token Volume and $USD Volume for all the differents Assets is higher with the All assets option, Single Asset is always lower!.
- $OSMO Is the asset with most $USD Volume provide by both type of Options.
- $HUAHUA is the asset with most Token Volume provide by both type of Options.
Dashboard Made by popex404 Twitter Link
🔍 Data Analysis🔍
- In both Charts the amount of Liquidity provided by the All assets Option (Orange) is always higher than Single Asset Option (Blue).
- Because both charts are log scaled, the difference between both options are much higher than what it seems.
- $HUAHUA is the asset with most Token Volume in both Options.
- $CRBRUS in Second Place.
- $OSMO is the asset with most USD Volume in both Options.
- $ATOM in Second Place.
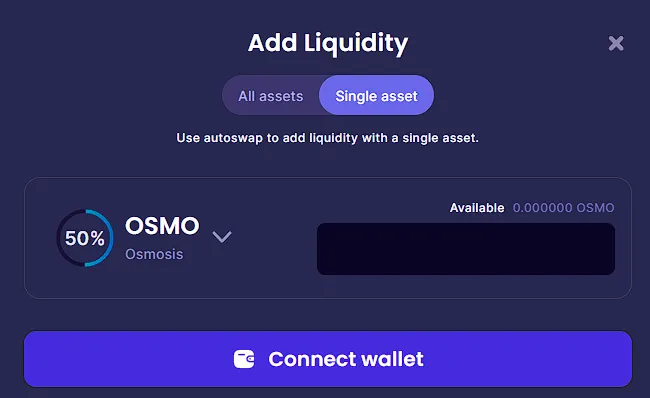
When you add liquidity to a pool you can see 2 options.
- All Assets: Choose the amount for all your assets to provide liquidity.
- Single Asset: Choose the asset to provide liquidity (you can change the asset with the ↓ arrow).

Dashboard Structure
- General Metrics (Numbers and Donuts):
- Options by Number of Users.
- Options by Number of Transactions.
- Options by $USD Volume.
- Average Amounts (Number Metric).
- Daily Metrics (Bar):
- Daily Users by Option.
- Daily Transactions by Option.
- Daily $USD Volume by Option.
- Percentage of $USD Volume (Area Metric).
- Assets Metrics (Bar):
- Assets Token Volume By Option
- Assets $USD Volume By Option
- Metrics by $USD Amount (Bar):
- Users by Option and $USD Amount.
- Transactions by Option and $USD Amount.
- $USD Volume by Option and $USD Amount
The last metrics are using the $USD Amount of the Transaction.


- The Active users seems pretty balanced for both options, although the number of users using All assets is slighty higher in all the days.
- During the First Quarter (Q1) of 2022, the active users seems to increase a lot, and then after May it reach their lowest numbers.
- User activity reach a spike in the end of October 2022 and the start of November, although these numbers can’t compete with the start of the year.
- Again the transaction activity is pretty balanced for both Options, this correlates pretty well with the User chart above.
- Activity spikes in the Q1, then drops after May.
- There is a spike in October-November 2022.
- Here the things aren’t correlated, during Q1 of 2022, most of the USD Volume by far is from All Assets Option, and Single asset is always very low.
- But from July Onwards, the USD Volume is really small that is invisible, here we can see some days where the single asset bar (blue) is more visible than the all asset bar (orange).
- It’s seems there are days where the USD Volume for the Single Asset option is higher, but overall thanks to the Q1 2022 The difference is bigger for All Assets.
- The differences of USD Volume talked before can be seen here, with some days after July 2022, that have more than 50% of the total Volume for the Single Asset Option.
- With a Max of 74% of USD Volume coming from Single asset vs All assets in September 16.
- But in the end All assets have more dominance over Single assets, in both percentage and total USD volume.


- In both options, the amount of users starts to decrease with more $USD Amount provided to the liquidity pools.
- The main difference is that all assets users, are higher than single asset users.
- But overall the amount of user per tier, is the same with single asset having less than all asset option.
- The same happens for transactions by tier, both charts are similar, with the main difference being the actual number.
- But the difference between tiers is practically the same in both options.
- In volume we can see the first big difference (aside from the total which is always bigger for all assets).
- That difference is that the amount provided by the tier $100,000 to $1M is really higher in All assets than Single Assets.
- User which deposit that amount prefer to do with the All assets option over the single asset.
- Other differences come from the previous tier “5” $10,000 to $100,000 and “3” $100 to $1000.
- USD Volume from tier 5 is higher than tier 3 in All assets, meanwhile tier 3 is higher than tier 5 in Single Assets.
- in Both Options the 4 tier $1,000 to $10,000 is the one providing more $USD Volume.