In the News - 12. Groundhog Day
What kind of season is going to arrive in 2023, let's take a look at some correlation metrics between differents tokens in the Web3 Featuring EVM/IBC and Layer-1 Blockchains.

⛄Oh Wise Groundhog tell us more about this Crypto Winter⛄
Since the second Quarter of 2022, web3 users were reliving the same events again and again.
- One Token crashed, followed by a Company Crash, which was borrowing from another Company leading to another Crash.
-
One Token crashed again, more Companies crashed, and this is the survival on this CryptoWinter were everyone is holding their altcoins with the hope of a new Spring where these tokens can grow again and gave us hope for everything we lost in the winter.
\
-
But as the wise Groundhog tell us the comforting words that spring is going to eventually arrive today i’ll show you that no matter which blockchain you are, everything is connected and spring is going to reach every Blockchain.
Links: Groundhog Day, Groundhog Image
♾ Everything is Connected ♾
I can’t predict the day when Spring arrives, but i can show you that when spring arrives is going to reach every place of the Web3.
So my objective is going to show how differents kinds of blockchain are connected “by the invisible hand of Web3”.
I’ll focus on these 3 kinds:
- Ethereum Virtual Machine (EVM): Ethereum - Polygon - Optimism
- Inter-Blockchain Communication== (IBC): Cosmos - Osmosis - Terra
- Layer-1 Blockchains== (L1): Bitcoin - Solana - Flow - Near
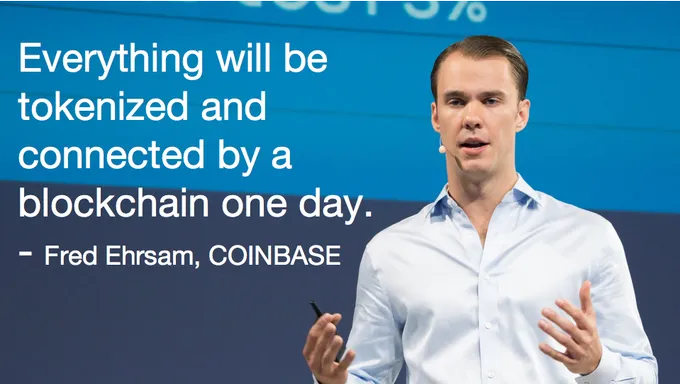
Links: Fred Ehrsam Image
🔎Proof #1 - Analysis🔍
I decided to start with my better proof, a correlation between the 10 Tokens Price Growth Rate. although there are 10 differents Growth Rates Curve for each Token, surprisingly the chart seems to have a nice and clean correlation:
- But where is the diversity if all the tokens react in the same way?.
- That’s the reason of the difference we can perceive in the differents spikes, every Crypto token has different growth rates, sometimes all of them will present a daily positive growth, but only one of them will have the biggest growth meanwhile the others will have a small growth.
- Or sometimes only half of the token will have a positive growth meanwhile the rest will present a negative growth on that day.
- Although every day these tokens have some minor or bigger differences in their growth rate, is at the long run where we can see that every token is connected.
- From Zero to Hero (Since FTX Crash)
- In November 9, every token presented a Negative Growth, and from that point started their adventure to surpass their first Winter Barrier.
- This Barrier is reaching the same price as they presented prior the FTX Crash, and this is a long journey as we can see that after November 9 there isn’t a single day in 2022, where the tokens correlate in the same uptrending spike.
- But in January 2023, there are 3 significant days were their growth rates correlates in an uptrending.
- January 4: The first Uptrending, specially for Near (+13%) and and Solana (+11%).
- January 9: The second Uptrending, with Solana (+20%) and Optimism (+14%) at front.
- January 14: The last and Biggest Uptrending for all the tokens starting with Osmosis at (+4%) and Ending with Solana with (+32%).
- January as always bring us Hope
- There isn’t and ending to the Crypto-Winter at the moment, but with less than a half of the first month of 2023, we can already see that most of the tokens recovered the price lost after the crash.
IBC Blockchains - Osmosis & Terra & Cosmos
🔎Proof #2 - IBC Analysis🔍
There seems to be a big difference in transactions and users for all three blockchains with:
- Osmosis having the biggest amount of Transactions and Users.
- Cosmos with almost half of the users of Osmosis and less than half of the transactions from Osmosis.
- Terra with the small amounts of Users and Transactions.
Because of that, the correlation of Active Users/Transactions Growth rates isn’t too good.
But the Price Correlation for each IBC Token is more easy to see.
With the $LUNA having the best growth rate for price in the past days.
Layer-1 Blockchains - Flow - Solana - Near
- $BTC is present only as token.
EVM Blockchains - Ethereum - Polygon - Optimism
🔎Proof #2 - EVM Analysis🔍
There are again some significant difference between EVM Blockchains.
- Polygon having the biggest amount of Transactions and Users.
- Ethereum with some biggest spikes in Users some days with more than Polygon and more Transactions than Optimism
- Optimism with the small amounts of Transactions and Users
In this case the correlation of Transaction Growth Rate may be more easy to see than User Growth Rate.
Price Correlation for each EVM Token is easy to see.
With $OP Having the best Growth Rate in Price the last days.
🔎Proof #2 - Layer 1 Analysis🔍
The difference in transactions is really big, with Solana having the biggest amount of daily transactions of all the blockchains present here.
- Solana having the biggest amount of Transactions and Users.
- Flow with some biggest spikes in Users and more Transactions than Near
- Near with the small amounts of Transactions and some days with more Users than Flow.
Because of that, the correlation of Transactions Growth rates isn’t too good again, with Flow having less correlation with the other 2 blockchains, because of the users spikes.
- Although Solana and Near may correlate in User Activity better than in transactions
But the Price Correlation for each Layer 1 Token is more easy to see.
With the $SOL having the best growth rate for price in the past days.
🔎Last Proof - Token Price Analysis🔍
On the Five Charts Above ==i paired Tokens from differents kinds of Blockchains and see how well their price correlates daily.
And surprisingly all the charts correlate really well, it may be some differences between the price but the downtrends and uptrends are almos identically if not for the nature of the tokens to have their differences.
All the tokens presented the same Downfall at the start of the FTX Crash, ==and we can see some tokens that already beated the first stage of the Crypto-Winter.
- Optimism ($OP): This token is the only one that improve their price prior to FTX Crash, going from $1.325 to $1.8
- Bitcoin ($BTC): It’s seems that Bitcoin is reaching finally their price before the FTX Crash, and this is one of the most important achievement, because $BTC price tends to affect every token significantly, improving their max value since the FTX Crash is one of the Key to end this winter.
- Ethereum ($ETH): Following the steps from $BTC, $ETH is also reaching their previous value from the FTX Crash, which is another important key to beat the Crypto Winter, being with the $BTC the top Cryptocurrency, so the rest of the Tokens may follow their Steps.
- Terra ($LUNA) - Cosmos ($ATOM) - Near ($NEAR) - Polygon ($MATIC) : These 4 tokens are in their middle point, and it may take a bit too long but these tokens are also in their road to improve their price again!.
- Osmosis ($OSMO) - Flow ($FLOW): These are the last tokens in the race to reached their initial value before the FTX Crash, it may take a while but if the Crypto-Winter end these tokens will start their ascend asap.
Summary
My first goal was to show how every blockchain is connected, and in the case the Winter ends or Continues, is going to affect every Token equally.
For that i used three Proof:
- Proof #2 (Correlation Between Blockchains from the Same kind (IBC-EVM-Layer1) ):
- We saw that although it may be a big difference between transactions or users, we can still found some points of correlation in the Growth rate for both metrics.
- And that all token prices correlates really well daily.
- Last Proof (#3) (Correlation Between Blockchains from different Kind):
- Comparing the Price of differents Blockchain we can easily identify the same correlation trends from both of them, although some tokens may have differents values, thanks to the diversitiy of Blockchains, all of the tokens are trying to recover their price prior to the FTX Crash.
- First Proof (#1) (Correlation of each Growth Rate):
- Putting all the Price Growth Rate in the same table, doesn’t make a mess, we can easily saw that every growth rate correlates really well against the other tokens, because in a sense all the tokens have the same trends of price, and the price of one may have a direct effect on others tokens.
What Kind of Prediction will the Groundhog made
In only half of the first Month of 2023, $ETH and $BTC almost recover their price prior to the FTX Crash, and after they beat that downfall, other tokens are going to do the same as well, making every Crypto Currency Continuing with the Uptrending.
But this is only possible with the guide from these top 2 currencys ($ETH/$BTC), so they need to be constantly uptrending and improving their price above and beyond the price prior to FTX.
That is going to be the First Part to end this crypto winter, then it surges the need to every other important asset to reach and improve their price prior to FTX.
And this is only to be possible during the first Quarter of the Year, thanks to the Hype and Power Boost of a new Year.
But For Spring to really start in Web 3, it may take a while but as the Groundhog says.
No matter how long the winter spring is sure to follow
Dashboard Made by Popex404 - Twitter Link Here
Methodology
Using FlipsideCrypto Data tables:
(Terra/Cosmos/Osmosis/Ethereum/Polygon/Optimism/Flow/Near/Solana).core.fact_transactions:For Transactions and Users of Each Chain.(Tx_Hash/tx_id):To get the Transactions.(Tx_Sender/Tx_From/from_address/tx_signer/authorizers/signers[0]):To get the Active Users.- And finally i applied my SQL Recipe to Get Growth Rate.
- Using
Lag() Function, details at my SQL.
- Using
crosschain.core.fact_hourly_price:To get the $USD Price of the Tokens.Avg(Close)To get the daily Average Price of the token.where id = ‘API id from coingecko’To select an specific Token.- Coingecko Sample.
MetricsDAO Question
- It’s been a harsh few months of winter in the crypto market, with token prices falling hard and once-stable companies and organizations reducing workforces or even vanishing overnight. With Coinbase announcing another layoff of nearly 20% of employees, some might be feeling like Bill Murray in Groundhog Day, forced to relive events over and over again.
- With that in mind, let’s turn to our friend the groundhog for an early crypto-winter prediction: are we nearly through to spring, or will winter’s cold snap continue on even longer? Back your assertion by creating a dashboard with on-chain data that supports your arguments in favor of either a continued downturn in the space or a soon-to-come rally.