Megadashboard of Developer Activity in Near
After Electric Capital published their yearly report, They provide us with the data to work on!. So this time i'll show the Developer Activity in Near and look at how it's growing up. I'll focus in 3 differents aspects: The GitHub Organizations related to Near, the GitHub Repositories related to Nier and the GitHub Developers Working On these Near Projects.
2022 Electric Capital Developer Report
In January 17, 2023 Electric Capital Published their Yearly report about Developers in Crypto. Additionally this time they launched a public live dashboard.
> Electric Capital has 14 years into the creation of open-source crypto, and fingerptrinted 250 million code commits across open-source repositories to create the 2022 Developer Report. > > The reason to focus on Developers is because they’re an early and leading indicator of value creation … Developers build killer applications that deliver value to end users, which attracts more customers, which then draws more developers. 2022 Developer Report by Electric Capital
Near in the Developer Report
In the 2022 Developer Report Near is in the 301-100 Open Source Developers in 2022, and having a yearly growth rate of 40% with 500+ Monthly Active Developers.
In this dashboard we’ll focus on Near GitHub Activity from a new Beta Table from Flipside called near.beta.github_activity and we’ll look at the growth of developers and activity.
I’ll provide some relevant images from the Developer Report too complement parts of the analysis, and you can also see the relevant activity of a single Repository in Near of your selection in the parameters.
Understanding the “Activity” from Near GitHub Table.
As explained by @forg#9122/forgxyz activity here isn’t when a developer makes a commit or change/add some lines of code.
Activity is when an user opens== an Issue or a Pull Request (PR). And the goal is to capture the “Collaborative Development” of Near.
Add Text Here
Methodology
Images Source: Electric Capital, Near Protocol.
Using the New Table from GitHub Activity that FlipsideCrytpo forked from Electric Capital GitHub, More Details at Forg Github.
Activity is every Issue or Pull Request Made that was discussed and resolved, as detailed in Forg Github.
Using the tables column to get different Information:
Author: As the Developer making Activity.Createdat: The Date when the activity is registered.ORG: The Organization the Developer is from when making the Activity.REPO: The Repository where the Activity is registered.ThumbsUP: The amount of Likes the Activity ReceivedAuthorAssociation: The Association the Author has.
Using only these columns i made a lot of differents charts and you can see the methodology in their respective SQL.
Summary
Near is Growing and we can easily see this in most of the charts here, every year the amount of New developers, repositories and organizations was increasing by a large amount if not the double in comparison with the year before.
Most of the developers were making only 1 Issue or Pull Request, but the amount of activity coming from the Full Time Developers was the most important and relevant.
Near Founder Illia Polosukhin was one of the Developers with Most Activity.
But in the past year of 2022 we can see a surge of more than 1000 Developers making important Issues and Pull Request on differents Near Projects, and is only a matter of time until Near reach the Blockchains with most developer activity such as Solana, Polygon or the King of all Ethereum.
Made By Popex404, Twitter Link Here
🔎Comparison Analysis🔍
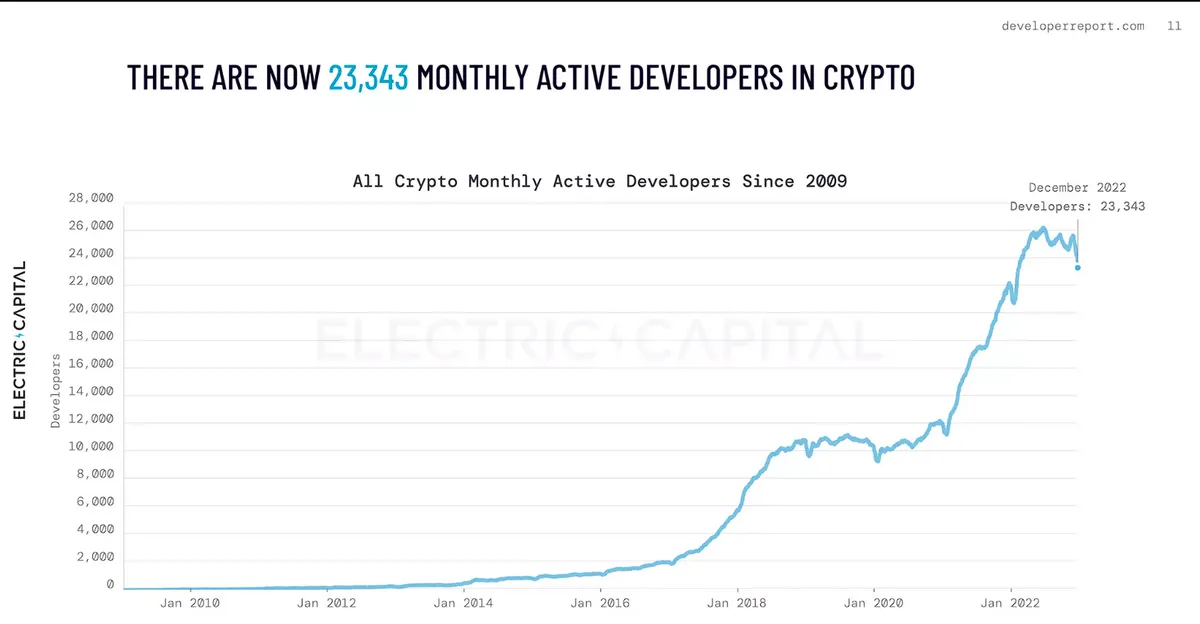
Screenshot from Page 11 Developer Report.
- Meanwhile the Active Developers increases a lot for in the crypto space during 2019, in the case of Near the uptrend is a bit slower until March 2020 were spikes from 59 to 213 in 2 months.
- But in both cases the increase from Jan 2020 to Jan 2022 is really high, Near starts January 2020 with 47 Active Developers in that month, and after 2 years in January 2022 it has 307 Active Developers.
🔎Total Metrics and Activity - Analysis🔍
There is a significant amount of Total Developers in Near, which are participating in different repositories since October 2018 the first month where the participation was from 2 developers, a member and a contributor.
- Since that point most of the active developers are Contributors.
- The amount of Developers with the association of Member and Owner is really low but years later the amount of members increases from the less than 10 to 20-35 active members per month.
- In all Monthly Spikes the activity from Owners is significant higher.
- There is a significant amount of Monthly active developers without association (None).
- From the Daily Chart, we can see that every month with spikes presents a significant amount of activity from the 20th to 30th of each month, meanwhile developer activity seems to be less at the start of each month.
- There are exceptions but the biggest daily spikes from the months with high amount of developers are located for example in May 20-21, 2022 or June 20-23, 2022.
🔎Type of Developers - How to Identify them?🔍
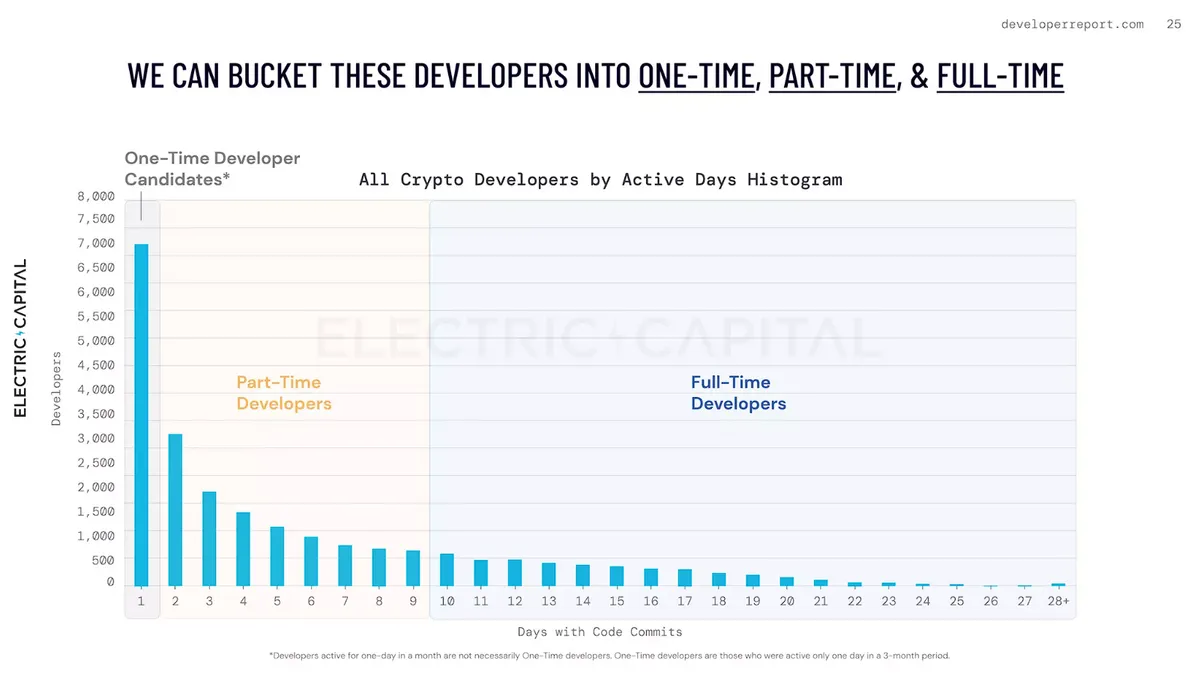
Screenshot from Page 25 Developer Report.
Looking at the Active days of the developers Electric Capital group these developers by the following methodology.
> * Full-Time Contributors - Contributed code 10+ days out of a month. > * Part-Time Contributors - Contributed code fewer than 10 days out of a month. > * One-Time Contributors - Contributed code once in a rolling 3-month window. > > From Developer Report About
In my case i’ll group the Near developers from their Activity using the following Methodology
- We’ll count for each developer all unique
createdathistory, and with that we’ll know the active days a developer has. - A One-Time Developer Candidate will be every developer who only has day with 1 Issue or Pull Request.
- We can see that 1613 Unique Developers only made a collaborative development once.
- A Part-Time Developer will be every developer who only has 2 to 9 different days with Issues or Pull Request.
- A Full-Time Developer will be every developer who has more than 9 different days with Issues or Pull Request.
- i’ll add 3 more tier for this type of developers.
- Developers with 10-31 days of activity, 32-93 days of activity and 94 or more days with activity.
- i’ll add 3 more tier for this type of developers.
🔎 Developer Activity by Time Periods Analysis - How DAU/WAU/MAU/YAU Works?🔍
(Daily/Weekly/Monthly/Yearly) Active Users help us to see the activity of each Month (Left) or Year (Right) showing us the average of the smaller time periods, as example:
- The First Year (2018) of the right chart show us the following values: 11 YAU (11 Unique Developers making Activity in the year 2018), 6.3 MAU (An Average of 6 Developers making Activity Each Month of 2018), 4 WAU (An Average of 4 Developers making Activity each week of 2018) and finally 1.9 DAU (An Average of almost 2 Developers Making Activity each day of 2018).
- Because we look at the year as a whole we may missing more precise data and thats where the left chart plays an important role, We can see that activity only starts in October 2018 with 2 MAU (2 Unique Developers making activity) 1 DAU and 1 WAU, in this case the MAU is the total Unique and not an average!
Now that the concept is explained let’s dig deeper
- In 2019 there were 108 Unique Developers (YAU) with an average of 27 MAU, 16 WAU and 5 DAU, This already is a good growth with 97 Developers Arriving in 2019.
- November was the month most active in 2019, with 57 Unique Developers (MAU) and average of 33 WAU and 10 DAU having 2x (double) more activity than the average month of 2019.
- 2020 reached more than Double of the Yearly Metrics of 2019, with 436 Unique Developers (YAU), and average of 91 MAU, 45 WAU, 13 DAU
- May was the month most active in 2020, with 188 Unique Developers (MAU) and average of 84 WAU and 21 DAU, a really busy month for this year
- Although 2021 Growth wasn’t explosive, the amount of Unique Developers in the Year (845 YAU) and the Average of the Month (155 MAU) continues growing in significant amounts.
- December 2021 was the month most active in 2021 with 235 Unique Developers (MAU) and average of 95 WAU and 24 DAU
- And Surprisingly 2022 a year where most of the cryptocurrencies lost most of their previous value, have another explosive growth.
665 New developers started working in Open-Source Projects on Near this 2022
In comparison with 2021, besides there is an increase of 113 Developers on the average per month, 40 in the Weekly Average and 8 in the daily average. Making this year the best in growth (by Raw Numbers)
June 2022 was the peak month for developer activity with 330 Unique developers making issues or pull request 129 as the weekly average and 31 as the daily average.
🔎Monthly and Yearly ==Activity== Growth Rates - Analysis 🔍
Looking at the Yearly Activity is easily to see how in the last year (2021 → 2022) Developer Activity was the only with a biggest slope than before, Organizations and Repositories also increased but their slope is smaller than before.
- The first 2 years the growth rate became really explosive because at the start the number of projects and users were really small, and we can appreciate this in the Monthly growth rates.
- For example Monthly Growth Rate for Organizations tends to have more spikes because in some months there isn’t a single new organization aside from the olders.
- Aside from that, May 2020 was one of the best months for Active Developers with the biggest spike in growth rate (144%).
- Organizations and Repositories activity presents the best correlation of the trio, with similar values in both Monthly Activity and Monthly Growth Rate.
- But in Sep 2020 all three metrics starts to correlate in more months, such as May 2021, August 2021, January 2022, June 2022 and July 2022 (Negative Growth here for all)


🔎New Activity of Devs & Repos & Orgs - Analysis🔍
Since 2020 we can see how the cumulative charts starts increasing with a bigger slope than before.
-
In August 2020 & July 2020 the Percentage of New Activity reached higher spikes, and although Percentage of New Repositories and Organizations goes in a downtrend after that, the Percentage of New Developers goes in an Uptrend in 2021 and 2022.
-
Monthly Growth Rates have the biggest spikes in 2020, and after this year the percentage of growth for new Devs/Repos/Orgs seems to be small but most of the months ends with a positive growth instead of negative.
\
The Big Number Charts show us that the amount of new Developers, Repositories and Organizations is increasing every year.,
Repository ==Nearcore== is the most active every Month, and Dependabot a tool for testing and debugging has the most monthly activity.
🏆Top Developers🏆
Aside from the Bot for testing, we have important developers which are making a lot of issues and pull request which are:
- Bowen Wang (bowenwang1996): A Full Time Developer which have more than 1000 contributions each year between 2018 and 2020, the past 2 years was less active but he is an important developer for Near Protocol.
- Total Activity 992 - Total Days Active 552
- Illia Polosukhin (ilblackdragon): A Full Time Developer with more than 1000 contributions in 2019, One of the Founders of Near Protocol with a lot of activity in different Near Repositories.
- Total Activity 966 - Total Days Active 437
- Maksym Zavershynskyi (Nearmax): A Full Time Developer with more than 1000 contributions in 2019 and 2020, Another Important Developer for Near
- Total Activity 834 - Total Days Active 356
- Vlad Frolov (Frol): A Full Time Developer with more than 1500 contributions in 2020, he is working on differents repositories of Near.
- Total Activity 782 - Total Days Active 448
Amount of Contributions taken from their Github Profile
> # Organizations are shared accounts where businesses and open-source projects can collaborate across many projects at once, with sophisticated security and administrative features. - GitHub Docs
Near Organization is the one with most activity and is the one choosed by default to analyze.
The above table show the amount of repositories a developer from the organization worked on, although most of them are probably repositories from the organization the less active at the end could be external repositories.
↑ Here is the Weekly Percentage of Developers and Activity made from Developers of your ==choosen Organization
↑ Here is the the Percentage of Monthly Developers from your ==choosen Organization== that were active all the weeks in that Month.
> # A repository contains all of your project's files and each file's revision history. You can discuss and manage your project's work within the repository. > > Github Docs
Nearcore Repository has the most activity and the choosed by default.
↑ Here is the Weekly Percentage of Developers and Activity made from Developers working in your ==choosen Repository
↑ Here is the the Percentage of Monthly Developers working on your ==choosen Repository== that were active all the weeks in that Month.
Welcome to my MegaDashboard of GitHub Open-Source Developer Activity in Near - Read This First!
- 1.- There is a high amount of Charts here, and because of that ==some Browsers such as Chrome-Edge may have problem loading entirely== You Can:
- Open in other Browsers Such as Mozilla or Open a Preview Here.
- 2.- There are Parameters to track the Activity of Repositories and Organizations, and i put the most populars as default, later i’ll provide a table with all the Repos and Orgs if you want to look another.