NEAR - 3. The State of Staking
#NEAR #STATEofSTAKING #CITIZENSofNEAR #STAKE/UNSTAKE #VALIDATORS #VALIDATORSPOOL #DECENTRALIZATION #NORMALIZED FAIRNESS #NORMALIZED ENTROPY #NAKAMOTOCOEFFICIENT
Near Protocol is a Public Proof-of-Stake (PoS) Blockchain
- Aims to bring decentralization finance (DeFi) to the masses with low transfer fees and fast transactions.
- With their sharding technology (Nightshade) they achieve speed and scalability.
- Uses PoS consensus to secure and validate transactions on the blockchain.
- In Proof-of-Stake, users show support to specific network validators by delegating NEAR tokens to them. This process is known as staking. The main idea is that, if a validator has a large amount of tokens delegated is because the community trusts them, and these validators can validate block transactions and add more blocks to the Blockchain.
- Validators earn NEAR Token rewards for producing new blocks in the form of a static inflation rate of about 4.5% each year.
- Stakers get rewarded in the form of that token, too. The token’s all-time highest price was $20.44 in January 2022.
Sources: Coindesk, Near blog, The Defiant, Nightshade
Benefits of Decentralization
Provides a trustless environment
In a decentralized blockchain network, no one has to know or trust anyone else. Each member in the network has a copy of the exact same data in the form of a distributed ledger. If a member’s ledger is altered or corrupted in any way, it will be rejected by the majority of the members in the network.
Improves data reconciliation
Companies often exchange data with their partners. This data, in turn, is typically transformed and stored in each party’s data silos, only to resurface when it needs to be passed downstream. Each time the data is transformed, it opens up opportunities for data loss or incorrect data to enter the workstream. By having a decentralized data store, every entity has access to a real-time, shared view of the data.
Reduces points of weakness
Decentralization can reduce points of weakness in systems where there may be too much reliance on specific actors. These weak points could lead to systemic failures, including failure to provide promised services or inefficient service due to the exhaustion of resources, periodic outages, bottlenecks, lack of sufficient incentives for good service, or corruption.
Optimizes resource distribution
Decentralization can also help optimize the distribution of resources so that promised services are provided with better performance and consistency, as well as a reduced likelihood of catastrophic failure.
Source: Amazon
What is the problem? - Stake Pools Dilemma
The data where i obtained the general metrics (staking.actions) doesn’t match the data provided by Near.
- First if we look to the Total Net Staked $NEAR, this should be in a range of 469M $NEAR (amount provided from the report the state of staking), but the amount only reach 111.8M $NEAR.
- Second if we try to look the Amount of $NEAR staked in the validators stake pools using the (staking.actions) table, we can see that the amounts doesn’t match the same using the (fact.transactions) table.
- fact.transactions table method provided by Jacktheguy
- Worse than that, there is a lot of pools which have Negative amounts of $NEAR (from unstakes) in the left table.
- There seems to be a problem with the pool_address which aren’t the same, because they change address in the process or something like that!.
- In the right table we have positive amounts, but there is still some missing data from validators or total $NEAR Staked.
Only the charts about stake pools will use data using the other method!
🔍 Data Analysis🔍
- Stake transactions seems to be higher during the first weeks of the year and april weeks, but in November stake activity increases again.
- The first 2 weeks of April have a growth rate of 51% to 52%, in Stake activity.
- November 7 week (Alameda/FTX incident) was the week with most Growth rate with stake activity increasing 114% over the past week.
- Stake growth rate seems to be very stable, with drops of only -28% in stake activity.
- Don’t consider the incomplete data from this week (November 28) which messes up with all the ratios!
- Unstake transactions seems to be higher during January, and we can notice a tendency of less unstakes transactions over the year.
- March 28 week have the most growth rate in unstake transactions with a 54% more unstake than the past week.
- November 7 week also presents an increase of unstakes with a growth rate of 42%
- There is a lot of new stake users during April Weeks.
- Is important to declare that because this data was about 2022 only, most users from January will be tagged as new, so i’ll skip that month in both analysis.
- April 2022 presents the best amount of new stakers reaching a new user percentage of 78% during the week of April 11.
- November 7 also presents a spike of active and new users which remains over the following weeks.
- New user percentage remains always over the 33% so there is a lot of new stakers starting on Near.
- After April unstakers also starts to decrease a lot.
- February 14 and April 18 weeks presents the most new user percentage of 78% for unstakers.
- The total amount of unstakers is lower than stakers, but most of the weeks there are new unstakers over stakers.
- New user percentage remains always over the 50%.
🔍 Data Analysis🔍
Although stake activity was higher, than unstake activity the volume was almost the same, with only 4M net of stacked $NEAR.
- Stake Activity Raises during November 8 to 9, because of all the events happening on these days as consequence of Alameda/FTX Crash.
- Most of the stake transactions (6306) were with 10 to 100 $NEAR 43%.
- in Second Place were stake transactions (3735) with 100 to 1000 $NEAR 25.4%.
- Stake with less than 10 $NEAR is at 3rd place with a total of 3580 Transactions a 24.4%
- Unstake activity Raises in November 9.
- Most of the Unstakes were with 10 to 100 $NEAR (1303 - 32.7%) or Below 10 $NEAR (1218 - 30.5%)
- 24.4% with a total of 975 Unstakes were with 100 to 1000 $NEAR
- Stake Volume.
- Most of the Stake Volume comes from a single stake of 20M $NEAR in November 11, and is more than 50% of the total Stake Volume.
- There is another Stake with 1M $NEAR in November 6.
- Stake of 100,000 to 1,000,000 $NEAR provides 18.2% of the total stake volume.
- Unstake Volume.
-
There are 5 Unstakes of Over 1M $NEAR, during November.
-
November 14 is the day with the most amount of $NEAR Unstacked, most of the Unstacked volume from that day comes from a single Unstake of 8.6M $NEAR.
-
There are 2 Unstakes of over 1M which were made prior to the events of the FTX Crash.
\
-
Stake and Unstake Volume correlates very well, but in activity there seems to be some differences
📋Methodology📋
Using FlipsideCrypto data tables of Near (Curated by MetricsDAO)
near.core.dim_staking_actions
near.core.fact_transactions
Staking_Actions: To get data about Stake transactions, Citizens and amounts of Stake.
Fact_transactions: To get data about Validators Pools method provided by Jacktheguy.
I focused more in a depth Staking Analysis, because the article was about staking.
I decided to add some extra data in the end to show metrics to help visualize Decentralization in Near, because that was the main goal of the Article.
You can Visit Kasadegh, to see how Near is compared against Ethereum in these Metrics.
Dashboard Objective
The goal of Near article: State of Staking was to show how Near is becoming more decentralized, focusing in the Validators and their amount of $NEAR staked.
The article provide a good insight of Stake on Near, but there is a lot of metrics related to stake which weren’t present, so here you’ll see more metrics about Stake using Flipside Near Data (Tables Curated by Metrics DAO Community).
Because the goal of the transparency report was show decentralization using stake as example, i’ll add some metrics which help to see decentralization too.


🔍 Data Analysis🔍
- Looking at the number metrics, we can see that stake activity is high over unstake activity.
- Except for average $NEAR with is higher for unstake.
- Daily/Weekly/Monthly active users (DAU/WAU/MAU) charts are higher for stakers than unstakers.
- October 2021 the best month for stakers with a total of 24.678 active stakers.
- Aside from September 2021, all the months present over 1000 weekly active stakers, and always more than 100 Daily Active Stakers, both numbers are an average of all the days/weeks of the month.
- November 2021 the best month for unstakers with a total of 10.897 active unstakers.
- After May 2022 the numbers of unstakers drops to less than 700 weekly active unstakers and less than 110 Daily active unstakers, both numbers are an average of all the days/weeks of the month.
- In all the months the stake transactions are higher than unstake transactions.
- October 2021 have the most transactions in both type of Actions.
- From April 2022 to July 2022, Stake and Unstake Activity decreases.
- Except Unstake from June 2022 (3181) to July 2022 (3207)
- From August 2022 Onwards Stake Activity starts to increase.
- In all the months the stake amount is higher than unstake amount.
- Except for June 2022 with unstake amount being higher than stake amount.
- In 2022 the months with most unstake amount are May and November which can correlate with the crash $NEAR prices because the events of Terra/Luna - Alameda/FTX.
- Although October 2021 is the month with most activity, the total amount of $NEAR staked is really low.
- August 2022 and November 2022 are the months with most $NEAR staked.
- Stakers by staked amount refers to the actual staked amount they have right now.
- Almost Half of the Stakers have 10 or less $NEAR staked.
- The number of stakers seems to correlate with their amount staked, that means with more $NEAR staked, there are less stakers in that range.
- There are 6 users which have a net staked amount of over 1M $NEAR


📑Stake Summary📑
-
Stake Activity has decreased during 2022, with less transactions and less citizens staking/unstaking.
\
-
This doesn’t change the $NEAR Volume, with August and November the months with most $NEAR Volume in stakes after the downtrend of Activity.
\
-
Size Pools of Validators seems to change during 2022, with some validators losing their places (because of changes in their Staked $NEAR), but overall most of the year the total $NEAR Staked seems to stay over the 400M.
Near Loses Stake Activity in this year, but the $NEAR Staked doesn’t change, so most of the important stakers are still in the game!.
🔍 Data Analysis🔍
Using this method we can look at a total of 122 distinct stake pools (Validators) and a total of 454M staked $NEAR, these aren’t the exact metrics from the Near Article, but are pretty close.
- After the first weeks of January, the number of validators seems to mantain over 100.
- There are some exceptions with weeks having 94-99 validators.
- In the week of October 17 the number of validators reach their spike (129) with a growth rate of 15%.
- During November 7 week the number of validator reach 126, and then this number drops to 122.
- Overall the growth rate seems to stay between -10% and 20%.
- The Amount of Near Stacked seems to stay over 400M in most of the weeks during 2022
- August 22 Stacked Near in the pools seems to decrease and present their lowest value in 2022, but the following weeks it recovers and reach over 400M again.
- The Validators Pool size don’t change too much overall the months.
-
Staked.poolv1.near was the validator most affected during 2022, in the first months is the one with most Staked $NEAR but after June 2022, it loses their first place giving to
bzam6yjpnfnxsdmjf6pw.poolv1.near but although this pool have a large amount of Staked $NEAR, but more than 90% of their staked balance comes from a single ”citizen”.
The number 1 Validator nowadays is Figment and from their profile, there is a lot of stakers with high amount of $NEAR trusting in this validator.
-
Decentralization on Near Protocol
> These are some Mathematical ways to prove decentralization from this paper. > > Nakamoto Coefficient here > > These Charts are from kasadegh, Jacktheguy
What Now? - Important Analysis of Near Article
We already see a lot of information about Transactions of (Stake-Unstake), Citizens (Staking/Unstaking) and the Pools and their Size from Validators.
The previous metrics are some examples of the metrics that Near can add to their Article.
Because the main information were only 2 charts about their validators in general.
It’s seems the main goal of the article was showing their Decentralization, using Stake.
So for the final metrics i’ll show another examples of Decentralization.


Figment Networks is the world’s leading provider of blockchain infrastructure, supporting more than 60+ protocols and giving a lot of trust with their website and information to the future stackers which want to stake in their pools.
Figment Near-Protocol Site, provides a lot of information to stakers which want to start fresh in the Near-Protocol, and stakers providing more than 100K of $NEAR can get in touch to unlock the full Figment Experience
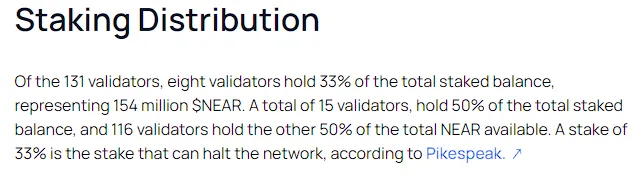
The Nakamoto Coefficient
Talks about the number of Validators (Node) necessary to halt the network, these Validators need to hold more than 33% of the total staked balance according to the Near Article.
Overall from September 2021, the number of validators required to “Halt” has increased from 7 to 8 (During the Article Period) and now to 9.
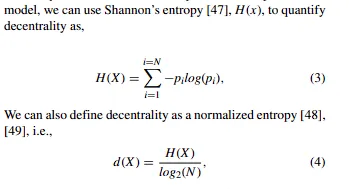
Normalized Entropy
In the Paper they considering the Blockchain System as an information Source, we can model it as a random variable.
> Here the amount of information emanating from assource is the amount of uncertainty that existed before the source released the informations
So correlating this with the creation of new blocks, the Normalized entropy show us the randomness to create new blocks, with a higher entropy being more random thus being more decentalized.
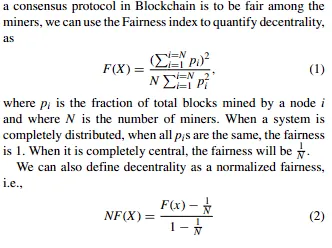
Normalized Fairness
Fairness is all about how fair is the Blockchain among all the miners, so when a system is completely distributed the normalized fairness is 1, but when it is completely central the normalized fairness will be 0.
The Fairness in Near seems to present a fall at the end of December 2021 and start of January 2022 (Entropy fall also correlates with these dates), but overall Near Normalized Fairness is slowly increasing in the last Month.

📑 Decentralization Summary📑
- Nakamoto Coefficient has increased to 9, after the report, so now is necessary an extra validator to Halt the network.
- Normalized Entropy is close to 1, so the validators choosed to validate the next blocks in Near have a lot of Entropy/Randomness in the process.
- Normalized Fairness, has decreased at the start of the year, but this amount is slowly increasing again, so most validators are choosed with fairness involved.