NEAR - 4. New and Improved Transparency Report
#NEAR #NEARTRANSPARENCYREPORT #NEARFOUNDATION #METRICSDAO #SUGGESTEDMETRICS #USERS&TRANSACTIONS #STICKINESS RATIO #EXISTINGVSNEWUSERS #VALIDATORSMETRICS #DECENTRALIZATIONMETRICS #BLOCKPERFORMANCEMETRICS
Near Protocol is a Public Proof-of-Stake (PoS) Blockchain
- Aims to bring decentralization finance (DeFi) to the masses with low transfer fees and fast transactions.
- With their sharding technology (Nightshade) they achieve speed and scalability.
- Uses PoS consensus to secure and validate transactions on the blockchain.
- In Proof-of-Stake, users show support to specific network validators by delegating NEAR tokens to them. This process is known as staking. The main idea is that, if a validator has a large amount of tokens delegated is because the community trusts them, and these validators can validate block transactions and add more blocks to the Blockchain.
- Validators earn NEAR Token rewards for producing new blocks in the form of a static inflation rate of about 4.5% each year.
- Stakers get rewarded in the form of that token, too. The token’s all-time highest price was $20.44 in January 2022.
Sources: Coindesk, Near blog, The Defiant, Nightshade
Near Transparency Report
In September 12 Near Foundation Published this article, in which they commited to publish transparency reports to expand the consistent and frequent comunnication with the NEAR community, after this article they published a few more transparency reports:
- September 12 NEAR Foundation Transaparency Report - Link: Here they published information about their number of New Accounts, Weekly Active Deployers and DAOs Amount.
- Also the Foundation talked about their launch of an $800M Ecosystem Fund for Q4 in 2021, and how they allocated these grants.
- November 18 Near Foundation Funding Team Report: September 2022== - Link: They Talked about September, with a focus on Grant Data, External Funding in the Near Ecosystem and Ecosystem Highlights.
- November 21 Near Transparency Report: the State of Staking== - Link: They talked about Stake in ==Near==, i already submited a detailed dashboard talking about this here.
- After this report they started to publish Weekly Reports.
- November 25 Near Transparency Report== - Link: In this report they presented the total $NEAR supply, Circulating Supply Statitics, Active Accounts and Daily Number of Transactions.
- December 2 Near Transparency Report - Link: The Foundation presented daily data about New Accounts, New and Active Contracts, Used and Gas Fees, Transactions.
- December 9 Near Weekly On Chain Data Report== - Link: The Foundation presented daily data with the Same Metrics from their December 2 Report.
So for this dashboard i’ll suggest some metrics they can include in their future Transparency Report.
🔍 Users and Transactions - Suggested Metrics Analysis🔍
- Weekly Transactions in NEAR vs Weekly Growth Rate: With this chart we can compare each week against the one before in terms of growth rate, weeks such as March 14, 2022 or September 12, 2022, are the weeks with most transactions and most growth having an increase of 142% and 162% in weekly transactions.
- Growth rate is a metric to compare against the previous week, because of that the growth in September is higher than the week of March, although in total transactions March week is bigger than September, but with this we can see measure the performance of that week with a percentage.
- Existing Users and New Users in Near vs New User Percentage: he problem for track New users is how you decided when they’re new or not, for example the weekly NEAR Reports show us a number of 12,000 to 15,00 new users in the first week of December, but with this chart we can see that the weekly amount of new users in NEAR was 76K.
- The Same happens with Active Accounts which that amount being lower in the report than here, with an amount of Active Accounts of 227k during the First Days of December.
- Using this chart we can see the real amount of Active Users and New users, which are counted from the start (February 2021) and also see the percentage of New users in comparison with the total.
- March 14 week and September 12 week have the biggest spikes in new user percentage.
It’s Seems that there are more New users in Near in the latest weeks.
🔍 Users and Transactions - Suggested Metrics Analysis🔍
- Cumulative Transactions and New Users in Near: Both Charts show us how the growth is daily.
- Transactions growth is almost the same every day.
- New Users presents some spikes in the growth which can easily be found in the Chart with the abnormal curves.
🔍 Users and Transactions - Suggested Metrics Analysis🔍
- Daily Active Users (DAU) vs Weekly Active Users (WAU) vs Monthly Active Users (MAU): The First Chart tracks the amount of Active Users by different Timespan and Compare them against all the months.
- Is really Good to compare Active users for month, and for example in September the amount of active users in ==Near== skyrocketed from 127K Monthly Users to 1.114M of Monthly Users.
- Also Provides Information for the Daily and Weekly Active users, with the last Months of Near having the most amount of Active Users.
- Stickiness Ratio (DAU/MAU): This chart show us the percentage of Monthly Active Users which were Active Daily, and since the start of Near this percentage raises from 4% to 10% in February 2022, in March 2022 drops to 4% and then it moves between 4% to 10%.
- The main problem is that months with a higher amount of users such as March 2022 or September 2022, may present a decrease in Stickiness Ratio because of the Amount of MAU vs DAU, but with this chart we can see how Active Are all the users present in a month, the same happens with months with less Monthly Active users such as February 2022 or December 2022, in the case of february, the stickiness ratio is bigger, but the amount of monthly users is low, in December because the month doesn’t end yet this stickiness ratio may decrease in January.
But Overall both Charts show us that NEAR in the last months is more active than ever.


Summary
Here i present metrics that NEAR should add to their report, i didn’t include general metrics which are already in the NEAR Transparency reports, and i focused in general metrics in 4 areas ==Near== Should Consider.
- Users and Transactions - Suggested Metrics: The graphics here are with the intention to provide different perspective for comparing Transactions and Users against itself, using percentages values such as Growth Rate, New User Percentage and Stickiness Ratio.
- Validators Pool - Suggested Metrics: Showcasing their Top Validators and some weekly metrics should be ideal for improve governance in ==NEAR==.
- Decentralization on Near - Suggested Metrics: One of the main goal for these transaparency report is to promote decentralization so adding these metrics based on Mathematical Analysis should improve their decentralization image.
- Block Perfomance on Near - Suggested Metrics: Nightshade technology is really good, so they need to showcase analysis based on block performance to show the High level Perfomance and faster transactions that ==Near== Protocol has.
Made by Popex404 - Twitter Link Here
🔍 Validators Stake Pools - Suggested Metrics Analysis🔍
- Weekly Number of Pools and $NEAR Staked vs Growth Rate: I already explained the reason to include growth rate, so now is time to explain these metrics.
- Number of Pools: To see decentralization is important to see the amount of Active Validators in the Near Ecosystem, we can see the amount of validators almost doubled from the weeks in 2021 versus 1 year later.
- Staked $NEAR: See the amount of $NEAR Staked is important to see also the governance in Near, most of the weeks the amount is over 400M, and in the last weeks the stacked $NEAR is higher than at the start of the year.
- Monthly Near Stake Pools by $NEAR Stacked:== The only reason i don’t put the stacked bars, is because when you put the cursor above you can easily see the top Validators pools at the top, ordered by $Near Stacked


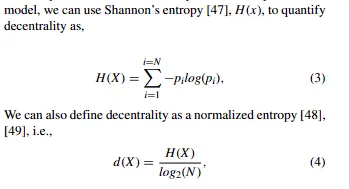
🔍Normalized Entropy🔍
In the Paper they considering the Blockchain System as an information Source, we can model it as a random variable.
> Here the amount of information emanating from assource is the amount of uncertainty that existed before the source released the informations
So correlating this with the creation of new blocks, the ==Normalized entropy== show us the randomness to create new blocks, with a higher entropy being more random thus being more decentalized.
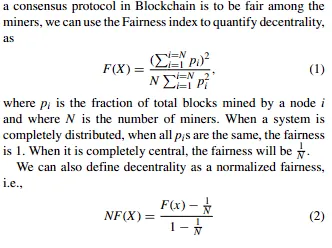
🔍Normalized Fairness🔍
Fairness is all about how fair is the Blockchain among all the miners, so when a system is completely distributed the normalized fairness is 1, but when it is completely central the normalized fairness will be 0.
The Fairness in Near seems to present a fall at the end of December 2021 and start of January 2022 (Entropy fall also correlates with these dates), but overall Near Normalized Fairness== is slowly increasing in the last Month.
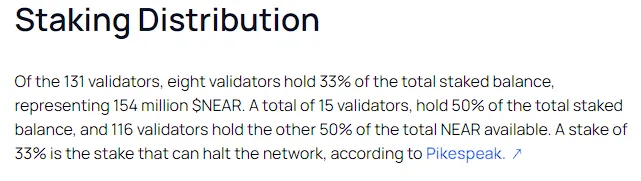
🔍The Nakamoto Coefficient🔍
Talks about the number of Validators (Node) necessary to halt the network, these Validators need to hold more than 33% of the total staked balance according to the Near Article.
Overall from September 2021, the number of validators required to “Halt” has increased from 7 to 8 (During the Article Period) and now to 9.
Decentralization on Near - Suggested Metrics
> These metrics are from kasadegh and Jacktheguy, using complex mathematical operations to calculate these metrics. > > Nakamoto Coefficient here. > > Entropy and Fairness from this Paper.

🔍 Near Block Performance - Suggested Metrics Analysis🔍
One of the things near always highlights is their sharding technology (Nightshade), but at the moment they never release a report about their block perfomance.
- General Blocks Metrics (Number): We can see that the block with most transations almost reach 1,000 and usually a block has between 5-6 Transactions.
- Transactions per Block in Near by Total Transactions: We can see that most of the blocks have 1 to 5 transactions or 6 to 10 transactions or 11 to 50 transactions and the amounts of these blocks is greater than blocks with 0 transactions.
- Block Time Perfomance in Near: The time between blocks in ==NEAR== is really fast with a minimum time of 0 seconds between blocks and an average/median from 1 Seconds.
- The Maximum time between in the last month happened in the last day with 416 seconds (Almost 7 minutes).
- NEAR Block perfomance is really good with the maximum time between blocks being 726 seconds (12.1 minutes).
Methodology
Using Flipside Crypto tables of Near (Curated by Metrics Dao).
near.core.fact_transactions:To get info about Transactions and users, filter withtx_status = ‘Success’to show only Successful Transactions.tx_signer: Here is the info about users making transactions that means the active users.tx_hash: Transaction ID here.- Most of the information comes from these 2 columns using
block_timestampto measure time. - For the Validators Pools i used Jacktheguy, query in which manually he “Trims” the data from this table to get the Near Amount from
tx:receipt[0]:outcome:logsand then usingtx_receiverwe can know the validators receiving the staked $NEAR.
near.core.fact_blocks:To get info about block performance using:- block_id: To get the amount of blocks.
- block_timestamp: To get the time of the block.
- tx_count: To get the amount of transactions per block.
Most of the Charts are using SQL recipes learned from my alchemist data bootcamp.
Decentralization Metrics are already explained.