Solana at Night
#SOLANA #FTX_CRASH #NOVEMBER2022 #DECEMBER2022 #SWAPS #POPULARSWAPSTOKENS #UNSTAKES #POPULARUNSTAKESPOOL #STAKES #POPULARSTAKESPOOL #SOLtoSOLSWAPS #NFTSALES #POPULARCOLLECTIONS #WASHTRADING #METRICSDAO #FLIPSIDE #OPENANALYTICS SOLANA
Where does the $SOL go after the FTX Crash?
The Solana Blockchain was one of the most affected after the incident (FTX Crash), with its native currency losing a lot of value and credibility, for this reason my objective in this report is to show the flow of $SOL in 3 different areas.
- Swaps using $SOL to swap from.
- Activity of top 6 Tokens being swapped with $SOL.
- What is $SOL to $SOL swap?
- Stake/Unstake activity in Stake Pools with $SOL.
- Activity of top 6 Stake Pools
- NFT Sales with $SOL.
- Activity of top 6 NFT Collections.
- Washtrading of a particular NFT Collection which trigger the Spike of $SOL Volume in November 30
I’ll track the activity from November 2022 onwards, to see how the Solana community was acting during the incident which happens between November 6 and November 12, and then the aftermath activity.

We can see that most of the $SOL is flowing through swaps, but NFT Sales present more activity and users using $SOL to bought.
There are less users Unstaking, but the amount was bigger than Stakes which present more activity and users.
🔎NFT Sales Analysis🔍
New users means users buying their first NFT of November so thats the reason in November 1 all the users are labeled as New, we can see that during the incident the amount of new users is superior to the active users, with a percentage of above 70% in November 6 which starts decreasing until reaching 31% in November 11, after these days there is a spike for most active users buying NFTs in November 18, and only a 6.48% of the total Buyers in November were Buying NFTs daily.
Although the Incident presents a lot of transactions and Daily Buyers, the $SOL Volume doesn’t present big changes, and is only at the end of November when it reaches their spikes of $SOL Volume.
The growth rates reach their Spike in November 14 with a growth of 31% for the Swaps Transactions and November 4 with a growth of 208% for the Total $SOL Volume.
December presents some good Growth Rate in NFT Sales such as December 1, 5 and 9 with a growth between 32% - 28%.
November 30 is the day with most $SOL Volume in NFT Sales, followed by November 26.
It’s seems that NFT Activity doesn’t seem affected as the rest by the ==incident==.
🔎NFT Sales Analysis🔍
Most of the NFT Sales are with amounts of 1 ==$SOL or less, or between 1 to 10 ==$SOL, these Sales also present the most number of buyers.
NFT Sales of 10 to 100 $SOL are also really popular daily and also there are some sales of 100 to 1,000 ==$SOL in each day.
NFT Sales of 1,000 to 10,000 ==$SOL are concentrated in November 29 and 30, although there are some days such which have 1 or 2 Of these type of Sales.
🔎Analysis🔍
The Amount of $SOL flowing starts to increase after November 6.
- Swaps: During the Incident the $SOL Volume reached their biggest spike in November 9 with a Volume of $66M $USD being swapped in $SOL. After that day the volume starts decreasing reaching only 2 small spikes again on days 17 & 22 of November.
- Unstakes: During the Incident the $SOL being unstaked reach 2 spikes in November 8 and 10 with users removing 432k and 932k of $SOL staked.
- Stakes: The Amount of $SOL staked is higher in the first days and reach a spike during the incident in November 8 with 77k of $SOL Staked, in the aftermath the amount of Staked $SOL is higher than the Unstakes.
- NFT Sales: The amount of $SOL doesn’t change too much during the incident but is possible to see that the $USD Volume presents a notable decrease, in the aftermath there is a boom in NFT Sales which surpass the $SOL Volume from Swaps in the last days of November.
We can see the big difference between the $USD Volume before and after the $SOL price crash, although the spikes in $SOL are higher in the aftermath in $USD Volume aren’t bigger than the days Before the incident.
Swaps in Solana - Using $SOL as the Token to Swap From
Using solana.fact_swaps table to get all the info about Swaps
Swap_From_Mint = 'So11111111111111111111111111111111111111112':: to filter only Swaps with $SOL
succeeded = True :: to consider only Successful Swaps
block_timestamp >= '2022-11-01'  :: To get data from November onwards
Unstakes in Solana - Withdrawing $SOL from Validators Pool.
Using solana.core.fact_stake_pool_actions table to get all the info about Unstakes
Action ilike 'withdraw%' :: To get only Unstakes transactions
succeeded = True :: To consider only Successful Unstakes
block_timestamp >= '2022-11-01'  :: To get data from November onwards


Stakes in Solana - Depositing $SOL to Validators Pool.
Using solana.core.fact_stake_pool_actions table to get all the info about Stakes
Action ilike 'deposit%' :: To get only Stakes transactions
succeeded = True :: To consider only Successful Stakes
block_timestamp >= '2022-11-01'  :: To get data from November onwards


🔎Swap Analysis🔍
New users means users doing their first swap of November so thats the reason in November 1 all the users are labeled as New, we can see that during the incident the amount of new users is superior to the active users, with a percentage of above 50%, but also these days present the spike for most active users swapping, and only a 6.49% of the total Swappers in November were swapping daily.
Although the Incident presents the most number of transactions and $SOL Volume, the growth rates reach their Spike in November 23 with a growth of 122% for the Swaps Transactions and November 17 with a growth of 296% for the Total $SOL Volume.
🔎Swap Analysis🔍
Surprisingly most of the Swappers were Swapping with 1 to 10 $SOL, and in second place with less than 1 $SOL, the amount of swappers with most $SOL swapped were 20 in the range of 10,000 to 100,000 $SOL and we can see a total of 12 Transactions Swaps with that $SOL Volume Between November 8 and November 10.
Most of the Daily Swaps were made with an amount of 1 to 10 $SOL, followed by less than 1 $SOL and 10 to 100 $SOL.
🔎Swap Analysis🔍
It’s seems that most of the $SOL was Swapped to Stablecoins being USDC The popular choice, this token present the most $SOL Volume, Swaps and Unique Swappers, and was the option choosed by most of the users in Solana.
Aside from the users trying to exit Solana via stablecoins, there are a lower percentage of swappers which decided to swap their $SOL for Staked $SOL, being Marinade and Lido, Staked $SOL the popular choices.
Finally Raydium token presents a high swap activity and $SOL Volume during November 20 to 22.
What are the $SOL swap to $SOL?
One interesting token being swapped in high $SOL Volume was $SOL for $SOL, the amount of Unique Swappers doing these Swaps are the lower of all the tokens present, but the amount of Swaps was the highest, the reason behind these type of swaps is because people are looking to do a chain of swaps starting with $SOL and ending with $SOL with the goal of ending with more $SOL received than Swapped.
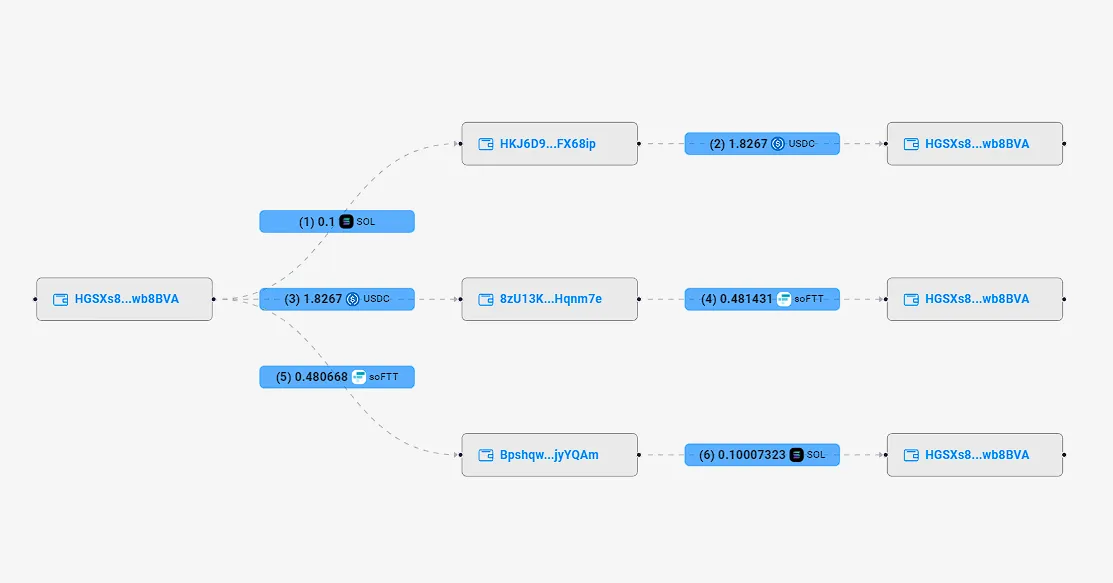
$SOL to $SOL Swap Example
Look at the Transaction Visualization from this transaction, Solscan provides us a visualization to see better how this chain of swaps work.
-
First the user swaps 0.1 ==$SOL== for 1.8267 $USDC
-
Then Swaps all the $USDC for 0.481431 $soFTT (Wrapped FTT Sollet).
-
Finally Swaps again 0.480668 $soFTT for 0.10007323 ==$SOL.==
\
We can see that with a swap of 0.1 $SOL this user ends with 0.00007323 extra $SOL.
This type of action is called Arbitrage and we can see a trend of these type of transactions ($SOL to $SOL) when Solana was at their most volatile time during the incident, and this will be my final analysis regarding swaps.
🔎Swap Analysis🔍
Here i provide 2 similar charts one for $SOL and the other for their $USD equivalent, we can see that the $SOL being Swapped and Received is almost the same, but if we look for each day, we can see that during the incident the amount of $SOL received after arbitrage swaps was signifcant lower than the amount of $SOL Swapped. But if we look to days such as November 1, 14 to 23, 26 and 27, these days the amount of $SOL Received was higher.
These kinds of Swaps were made by bots, using lower amounts of $SOL in each transaction, because there isn’t another explanation for more than 10,000 daily swaps with less than 100 Swappers, and although these are programmed to max their winnings using arbitrage, they lost a signifcant amount of $SOL trying to do Arbitrage during the incident
🔎Unstake Analysis🔍
New users means users doing their first unstake of November so thats the reason in November 1 all the users are labeled as New, we can see that during the incident the amount of new users is superior to the active users, with a percentage spike 90.84%, but also these days present the spike for most active users unstaking, and only a 4.85% of the total Unstakers in November were Unstaking daily.
Although the Incident presents the most number of transactions and $SOL Volume, the growth rates reach their Spike in November 8 with a growth of 546% for the Unstakes Transactions and November 30 with a growth of 6,767% for the Total $SOL Volume.
The Unstake Activity is concetrated during the incident, with the most ==$SOL== Volume, Unstakes Transactions and Unstakers Users
🔎Unstake Analysis🔍
Most of the Unstakers withdraw amounts of 10 to 100 ==$SOL==, followed by amounts of 1 to 10 ==$SOL and then 100 to 1000 ==$SOL, a total of 39 Unstakers withdraw amounts between 10,000 to 100,000 ==$SOL and most of these Unstakes were made during the incident, but there is an increase of Unstakes in the aftermath reaching a spike in November 24.
🔎Unstake Analysis🔍
Most of the Activity, Volume and Users from Unstakes are from Lido, being the Stake pool with most withdraws.
During the incident we can see some signifcant $SOL withdraws from Jpool (188K $SOL in November 8) and Daopool (22k $SOL in November 10) aside from Lido with more than 1M of $SOL Withdraws if we consider all the days of the incident.
Socean presents a notable amount of Unstakes Transactions but these $SOL Withdraws aren’t higher.
Lido Stake Pools suffers the most in November, losing a lot of ==$SOL== in their Stake Pools.
🔎Stake Analysis🔍
Most of the Activity, Volume and Users from Unstakes are concetrated in Lido and Marinade stake pools, this correlates with their $SOL== staked tokens being also the most active in Swaps.
In November 1 the biggest stake (100,000 to 1,000,000 $SOL) was made in Lido, reaching a spike in $SOL Staked of 407k from a total of 81 Stakes in Lido on that Day.
The amount of Users Staking is pretty good during all November, with the popular choices being Marinade and Lido to Stake ==$SOL.
Jpool presents an increase of Stake activity during the incident from November 7 to November 11.
Overall it’s seems that Marinade is the Stake Pool most stable, because it was the only one which wasn’t present in the top 6 Unstakes Stake Pools
🔎Stake Analysis🔍
New users means users doing their first Stake of November so thats the reason in November 1 all the users are labeled as New, we can see that during the incident the amount of new users is superior to the active users, with a percentage over 70.84%, but also these days present the spike for most active users Staking, and only a 4.85% of the total Stakers in November were Staking daily.
- It’s seems that Stake Users starts to be more active during and after the incident, making a lot of Stakes in these days.
Although the Incident presents the most number of transactions and $SOL Volume, the growth rates reach their Spike in November 21 with a growth of 512% for the Stakes Transactions and November 28 with a growth of 729% for the Total $SOL Volume Staked.
In November most users in the Solana Ecosystem started to Stake their $SOL, with the incident being the catalyst, we can see different spikes in Stake volume such as November 14, November 18 and also December 10.
🔎Stake Analysis🔍
Most of the Stakers are doing Deposits of 1 to 10 $SOL followed by amounts of 10 to 100 ==$SOL and then less than 1 $SOL, we can see a Staker which made a deposit of 100,000 to 1,000,000 ==$SOL in November 1 and during the incident the Stakes of 10 to 100 ==$SOL were the most frequent.
Stakes of 1,000 to 10,000 ==$SOL are made daily, with bigger amounts during the incident, and Stakes of 10,000 to 100,000 $SOL can be spotted in some days, with November 1 the day with most of these Stakes (3), and November 8, 14, 18 and December 10 (with 2 Daily Stakes)
🔎NFT Sales Analysis🔍
During November Y00ts, and Degods NFT Collections were the most Popular with most daily activity, but Lily Collection Starts their Activity in November 17&18 having a nice reception by the Solana Community with a Spike in Users/Sales and $SOL Volume on these days, and is the main reason behind the spike of NFTs in November 20.
Claynosaurz is another NFT Collection which started at the end of November and we can see that again the spike of Users, Activity and $SOL is made by them in the last days of November.
Degods NFT Collection Have a token called $DUST obtained by staking their NFTs, and this token also presents a good amount of Swaps using $SOL in November, i couldn’t include that token but i want to add this bit of information here if you’re reading that.
What About Beep Boop Battery NFT Collection?
This Collection is responsible for the Spike in $SOL Volume of NFT Sales in November 30, but the main reason behind that wasn’t for an active community it was for Washtrading, it’s seems that this NFT is possibly a Scam, and most of the Sales were made by accounts which were buying and selling this NFTs at a price of 4249 $SOL.
You can see in the table at the left all the Buyers and Sellers of these NFTs with a sale price of exactly 4249 $SOL.
All these Buyers buy these NFTs with 4249 $SOL and then Sold it again for 4249 ==$SOL.
The main goal of Washtrading is to elevate prices, and it’s seems that this NFT Only presents Activity in November 30.
- And it gives the NFT Sales the absurd $SOL Volume in that day.

Methodology
Although i explained the source of my information, i’ll specify more here, I used Flipside Crypto Solana Data.
-
Users:
I count unique SWAPPER or ADDRESS or PURCHASERfrom the Solana Tables of Swaps - Stake - NFT Sales. -
Transactions: I
count distinct tx_id,although i know that NFT Sales and Swaps can have multiple transactions, i decided to count distinct to have a better comparison between them and stakes. -
$SOL Volume: I
Sum SWAP_FROM_AMOUNT oramount/POW(10,9) or Sales_Amountfrom the Solana tables, Stake table is the only without the Decimal Adjusted so i have to divide using the decimal 9. -
$USD $SOL Volume: I Used the swaps table to get the median Price of $SOL being Swapped to Stablecoins, and then joining the tables.
-
For the Tokens Name i joined the label table with Swaps, and then i get the name of the Tokens Swapped.
-
For the NFT Collections i joined the label table,and then i get the name of the NFT Collections.
-
Stakes and Unstakes have already a column called
stake_pool_nameMade by Popex404, Twitter Link
Summary
The goal of this Dashboard was to show the flow of $SOL in differents areas, and see potential correlations with the incident (FTX Crash) here are the results.
- Unstakes: This Area is the most correlated with the ==incident==, because most of the Activity is concentrated between these days.
- Stake Pool Lido was the one which most $SOL== Unstaked, followed by Jpool.
- Unstake Activity decreases in the aftermath.
- Stakes: This Area correlates with the incident in a way that after the incident the amount of Active Users Staking doesn’t present a decrease, and the amount of Stakes mantains their numbers during November.
- Marinade and Lido Stake pools presents the most activity and Volume Staked
- Swaps: This Area reach the biggest spikes during the incident, and most Users swaps their $SOL for Stablecoins, the rest of users swaps for Staked $SOL (from Lido and Marinade).
- One of the Main Reasons the $SOL Amount is bigger in swaps is for Arbitrage Bots, which are swaping $SOL for $SOL during all the month, their presence is also bigger during the incident.
- Most Swaps from $SOL to $SOL have a Loss during the incident, with the amount of $SOL swapped Bigger than the amount of $SOL Received after Swaps.
- One of the Main Reasons the $SOL Amount is bigger in swaps is for Arbitrage Bots, which are swaping $SOL for $SOL during all the month, their presence is also bigger during the incident.
- NFT Sales: This Area is the less affected by the Incident, there a constant number of Users, Sales and $SOL Amount each day of November, and most of the Spikes in this area are made by release of NFT Collections such as Lily or Claynosaurz.
- This area present a biggest Spike of $SOL Amount in November 30, which were made by the Washtrading of Beep Boop Battery NFT Collection.
Although the $SOL price reached their lowest values in this year, most of the Solana users are trusting and staking their ==$SOL== or participating in distinct NFT Projects.
- Except for the ones which swapped their $SOL for Stablecoin and leave.