Solana: End of Year CEX Transfers
The data that has been used for this dashboard is explained as the end note.
Solana is a decentralized blockchain that draw a lot of attention in the second half of the year 2021. Its native token (SOL)'s price jumped 1000% in a few weeks and its TPS surged up to 65K at one point in that period. However, towards the end of 2021, the popularity of Solana gradually decreased. This up and down is worth investigating. This dashboard focuses on the last four weeks of the year and looks into how SOL outgoing flow from Solana wallets to centralized exchanges changed.
Overview
In this dashboard, first, I will describe changes in daily transfer flowing SOL to CEXes in the period between December 8th and December 31, 2021. The data shows an increase in transfers after a downward trend in the beginning. Then, I will discuss the possible reason behind this turnaroind. To support my claim, finally, I will examine other alternative explanations as well.
Graphs above show the number and volume of transfers to CEX per day in the period between December 8th and December 31.
As can be seen from the graphs, after December 13th, we have a considerable increase in outgoing flows to CEXes in both volume and numbers. The below graph demonstrates this more clearly. This trend cannot be explained without considering the context. On December 12th and 13th, Solana blockchain suffered a DDOS attack. (https://finance.yahoo.com/news/solana-price-suffers-goes-under-133525730.html?)
This can be an explanation of outgoing flow. The DDOS attack which did not occur for the first time on Solana blockchain may spread a threat among Solana adopters. They preferred to transfer their assets from blockchain to exchanges.
An alternative explanation would be the effect of price on behaviour of users. It is likely that in a bearish situation when the price is going down sharply, many transfer their assets to centralized exchanges to withdraw them to fiat currency. Also when a specific token loses its attractiveness it is likely that many withdraw their tokens from pools and trade to another token.
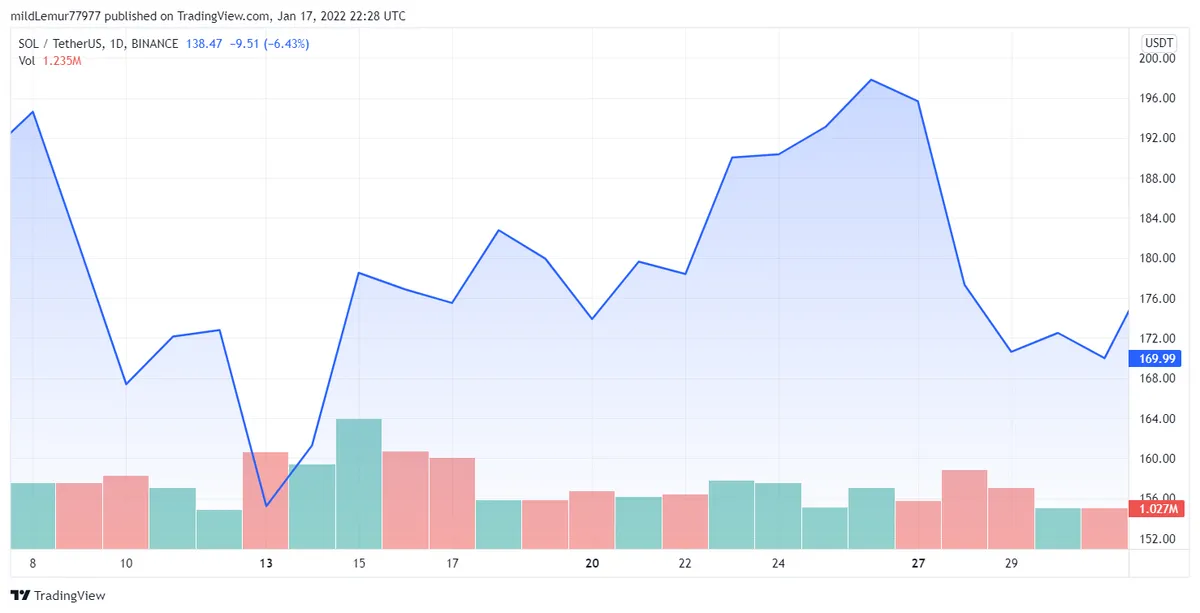
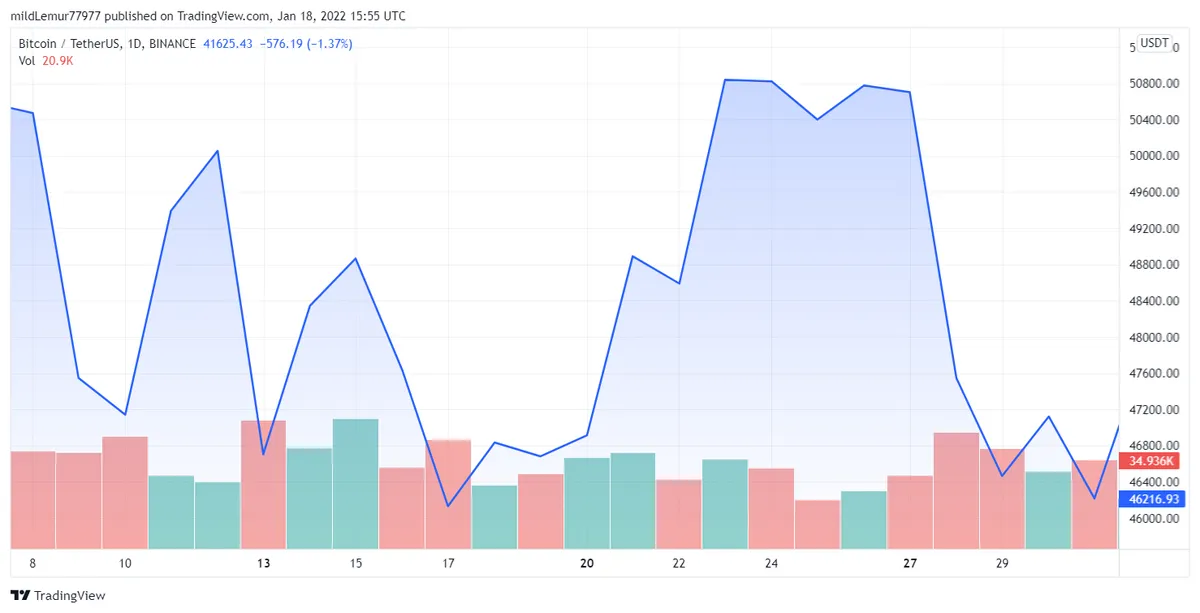
Below you can see the daily price of SOL and Bitcoin to USDT. As can be seen, none of them follow the above trend. For instance, from 23th and 27th both prices of Bitcoin and SOl was constantly high but we can see fluctuation in volume and number of transfer to CEXs.
Data
To create the proper dataset, I ...
constructed the following variables:
SELECT
-
date_trunc('day', days) AS date,
-
COUNT (tx_id) AS n_txn,
-
sum (amount) as volume,
-
succeeded
used the following datasets/tables:
FROM
- solana.transactions
- crosschain.address_labels
- solana.transfers
And set the following conditions:
WHERE/ON
- lower(crosschain.address) = lower(transactions.tx_to_address)
- label_type = 'cex'
- date_trunc('day', days) >= '2021-12-01' and date_trunc('day', days) < '2022-01-01'
- amount > 0