Unique Users
Introduction
Osmosis is a decentralized peer-to-peer blockchain using the Cosmos SDK. IT is an advanced AMM protocol that will allow developers to design, build, and deploy their own customized AMMs.
This dashboard provides an overview of daily active users of Osmosis. It also investigates what has been the largest event that has brought the most wallet activity to Osmosis.
Descriptive Results
The graph below shows how many unique wallets are active and how many transactions are executed on Osmosis per day.
We can see that in its peak in March and April 2021 there were about 60K wallets active on Osmosis. On late March also the number of transactions on Osmosis surged up to 600K.
There are three points that both number of users and number of transactions sparked:
-
23 April, 2022
-
22 March, 2022
-
12 May, 2022
The next sections are dedicated to a data-driven investigation to understand those spikes.
Investigation
First I looked into 'message type' (msg_type) to see how transactions has changed over time and specifically what type of transaction may lead to higher activity of users.
The graph below describes the proportion of 10 most popular message types all time. we can see that after transactions, message, and transfer, coin spent, and received and update client are the most frequent message types.
The graph below shows how message types have changed over time. It depicts top 10 message type of transactions.
Focusing on the three time points we can see that in all three there is abnormality in the pattern. on 22 March and 12 May coin_spent and coin_received dominance changed and on 23 April we can see a proposal vote message. We can expect that the reason behind the spikes on the former days is swapping and the latter voting.
LEt's dive deeper and zoom in on votes and swaps.
Attribute keys show an abnormality on May 12th. It is not telling.
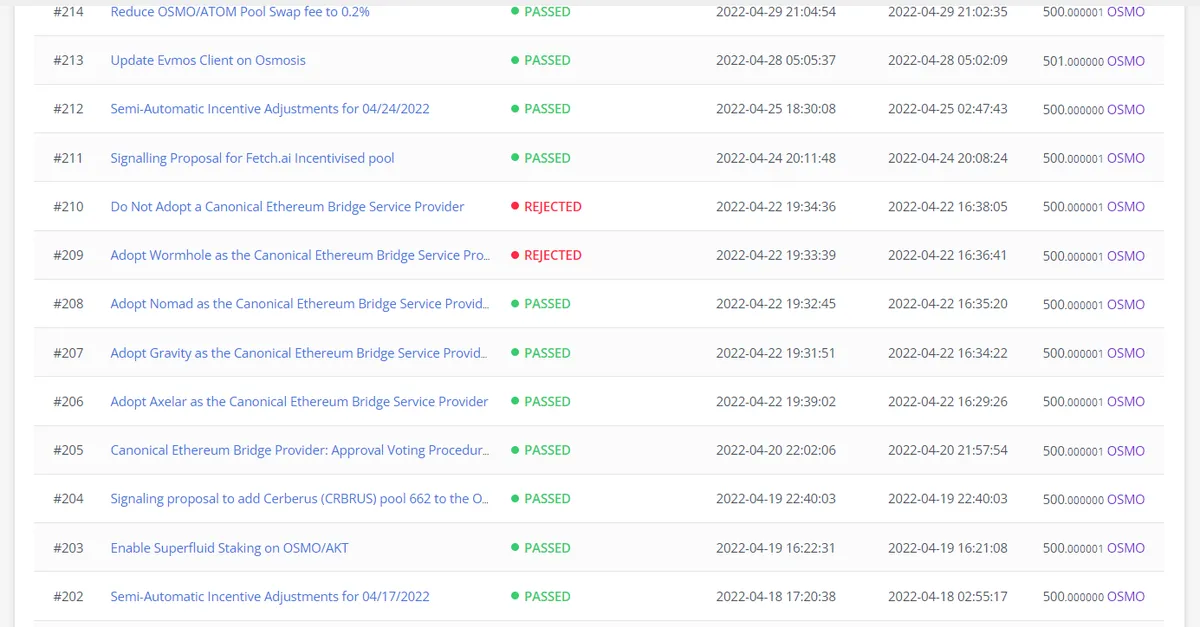
We can see that week starting on April 18th is a busy week with voting proposals.
Swaps
12 May marked the collapse of Terra station and depegging UST. In all networks involving UST the number of swaps surged. As can be seen from the below graph the pattern of daily top token being swapped for has been changed around May 12th.
We can conclude that the spike of user activities on May 12th is related to Terra collapse incident.
conclusion
This dashboard depicts the daily/weekly/monthly number of active users on Osmosis.
The graph shows three distinct spikes.
Through a data driven investigation, we found that what brought many users into Optimism on April 23rd was voting period and on May 12th the collapse of UST.
However, I could not find the event that led to the pick on March 22nd.