Customization Highcharts on Dashboard V.2
Highcharts on Flipside can be customized with CSS, HTML and Bootstrap 5 , which are those languages for customizing the front end of a website. Additionally ,the Highcharts function can be called with Javascript on JSON configuration.
If you have no knowledge about those languages, you can click links that place on the table below.
dashboard version : 1.3.0
( updated at : Dec 9, 2024 )Introduction
About me
A : Date and Time
A-I : default
A-II : short date
A-III : full date
The code shown above is that given after adding visualization in the studio, which is default.
  "xAxis": {
    "title": {
      "text": "monthly",
      "style": {
        "fontSize": "12"
      }
    },
    "reversed": false
  },
%b and %y in lower case for showing short month and year ( same as default date ).
  "xAxis": {
    "title": {
      "text": "monthly",
      "style": {
        "fontSize": "12"
      }
    },
    "reversed": false,
    "labels": {
      "format": "{value: %b %y}"
    }
  },
%B and %Y in upper case for showing fully month and year.
  "xAxis": {
    "title": {
      "text": "monthly",
      "style": {
        "fontSize": "12"
      }
    },
    "reversed": false,
    "labels": {
      "format": "{value: %B %Y}"
    }
  },
Full customization with StangFAST's style
  "xAxis": {
    "title": {
      "text": "<p>monthly</p>",
      "style": {
        "fontSize": "12"
      },
      "useHTML": true
    },
    "reversed": false,
    "labels": {
      "style": {
        "textAlign": "center"
      },
    "format": "<p>{value: %B <br /> %Y}</p>",
    "useHTML": true
  },
Question :
Why is there a p tag?
Answer :
Because I write CSS in the style tag to force showings of imported fonts by specifying and using the p tag.
day
name
    - Full weekday name          -> %A          Ex. Sunday, Monday, Tuesday
    - Abbreviated weekday name   -> %a          Ex. Sun, Mon, Teu

number
    - Zero-padded day of month   -> %d          Ex. 01, 02, 03
    - Day of month, plain number -> %e          Ex. 1, 2, 3
month
name
    - Full month name            -> %B          Ex. January , February , March
    - Abbreviated month name     -> %b          Ex. Jan , Feb , Mar

number
    - Zero-padded month number   -> %m          Ex. 01, 02, 03
    - Plain month number         -> %o          Ex. 1, 2, 3
year
number
    - Full year                  -> %Y          Ex. 2023, 2024
    - Two-digit year             -> %y          Ex. 23, 24
hour, minute, second
number
    - 12-hour clock              -> %I:%M:%S    Ex. 11:00:00, 12:00:00, 01:00:00

    - 24-hour clock              -> %H:%M:%S    Ex. 23:00:00, 00:00:00, 01:00:00

if you need a text to display as am/pm. (for only 12-hour clock)
    - upper case         -> %P     Ex. AM / PM
    - lower case         -> %p     Ex. am / pm
Variable for datetime
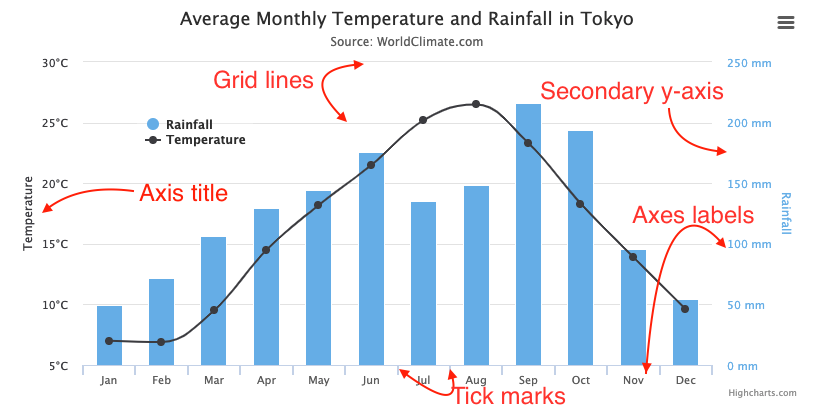
Labels
The axis labels show the number or category for each tick. Labels on this tutorial that included the x-axis and y-axis. It can be customized for showing the number or category if you want.
Texts and labels in Highcharts are given in HTML, but as the HTML is parsed and rendered in SVG, only a subset is supported. The following tags are supported: a , b, strong, i, em, br, span. Spans can be styled with a style attribute, but only text-related CSS that is shared with SVG is handled.
Most places where text is handled in Highcharts, it is also followed by an option called useHTML. When this is true, the text is laid out as HTML on top of the chart. This allows for full HTML support and can be a good idea if you want to add images in your labels, tables in your tooltip etc.