Ailing Alameda
Analyze what Alameda is experiencing. Rumors over the weekend began swirling that alameda research is on the brink of insolvency.
📜 Introduction
Recently, Coindesk has released a report on Alameda balance sheets, the report contains alarming information that alludes to liquidity issues or even a potential for bankruptcy.
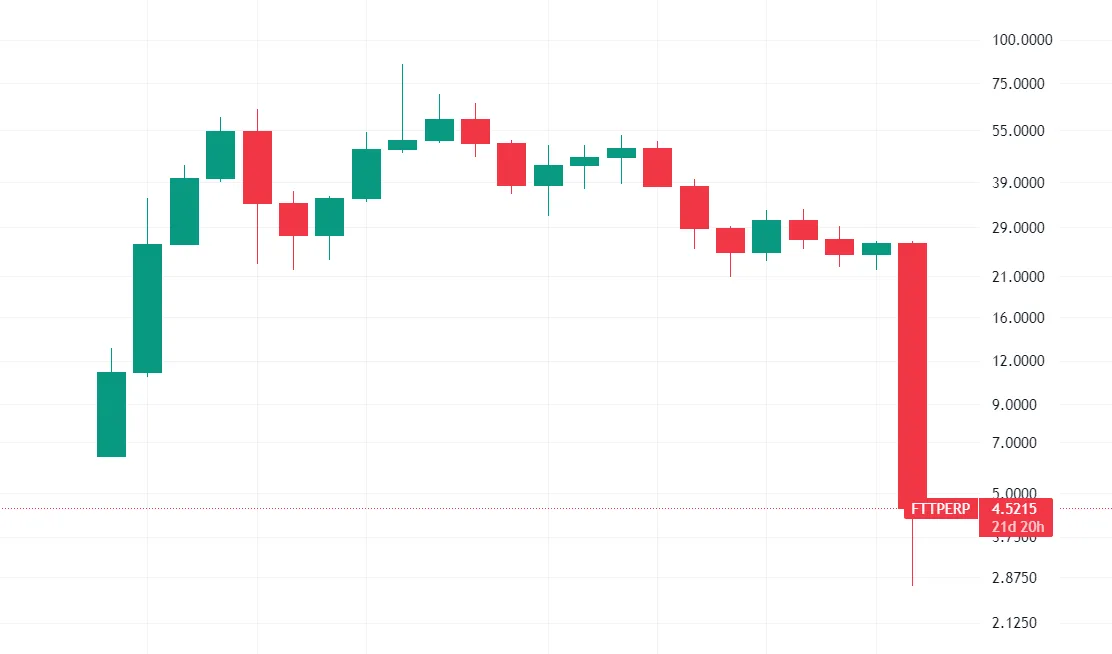
Over the past day, the cryptocurrency market has been hit by a massive correction in most cryptocurrencies, FTT token has fallen over 82% in the last two days (its chart can be seen in the image).
In this dashboard we are going to take a look at the FTX and Alameda Research wallets, and find out if the risks are real.
- First, we are going to take a look at the Ethereum wallets.
- Looking at daily net flow and flow of each token
- Examining cumulative net flow
- Find the top origins and destinations of funds on these wallets
- In the next step we will do the same analysis on their Solana wallets.
Alameda
Alameda Research is a leading principal trading firm. As a venture capital investor, Alameda has backed a large number of crypto startups, including non-fungible token marketplace Magic Eden and Anchorage Digital. Meanwhile, FTX Ventures raised $2 billion in funding in January. \n
🤔 Approach
Data Source and Tables
To conduct our study, we are using blockchain data provided by Flipside Crypto. From their datasets, following tables are used:
ethereum.core.ez_token_transferssolana.core.ez_token_transfersethereum.core.dim_labelssolana.core.dim_labels
Methodology & Definitions
We are using dim_labels table to look for wallet addresses related to FTX and Alameda Research. Fortunately Flipside Crypto provides easy to use tables such as ez_token_transfers that allows faster access to blockchain activities such as token transfer. We are using the mentioned table to gather stablecoin transfer transactions on both Ethereum and Solana blockchains. Required definitions are provided in each section.
Study Period
We are doing our study for last 30 days.
Funds Origins and Destinations
The chart on the left depicts top stablecoin inflow origins, the chart on the right side illustrates the top stablecoin outflow destinations on Solana.
It can be seen that:
- Gate.io is both top origin (with 89% of inflow) and top destination (with more than 59% of outflow).
- Binance is not present on Solana as a origin or destination for funds.
On both Ethereum and Solana top destinations and origins has been CEX platforms.
Daily USD Tokens Flow
This graph shows the daily Inflow and Outflow of wallets, the line chart shows the daily Net flow on Solana blockchain.
- During past 15 days, daily volume has increased compared to first half of past month.
- During past week there has been a massive outflow volume.
In Ethereum, the average daily inflow and outflow numbers were close to each other, so the net flow line was not too far from the center, on the other hand, in Solana, the outflow increased drastically in the last few days, resulting in a ==massive negative net flow.==
Token Flow Volume
The next chart illustrates the Inflow and Outflow as well as Net flow of each token on Solana blockchain.
-
All tokens have a negative net flow, which means that in the last 30 days, more volume has been transferred out of wallets.
-
USDT and USDC are the only stablecoins stored on wallets in Solana blockchain.
USDC with more than $1.12B of outflow volume is the top stablecoin on FTX’s Solana wallets, followed by USDT.
The flow volume in Solana is about one fifth of Ethereum.
Cumulative Net flow
The first chart shows the cumulative net flow volume of stablecoins in wallets related to FTX exchange on the Solana blockchain. The second diagram shows the same picture, but the individual symbols can be examined more closely. It should be noted that the volume of the previous 30 days is not included.
It can be seen that:
- Overall cumulative net flow has been positive through October 28th, one day more than Ethereum.
- As already stated in the Ethereum section, since October 28th, the net cumulative flow has been negative, meaning that increasingly more funds have been transferred out of the wallet than have been transferred into the wallet since the previous 30 days.
Funds Origins and Destinations
These charts illustrate top origin of funds and top destination for funds in the past 30 days.
It can be seen that:
-
Coinbase with 38.7% of inflow volume is the top origin of funds, followed by Okex with 25% and binance with 20% of the inflow funds.
-
Binance is the top destination for funds, with more than 57% of funds going into it, floowed by Coinbase and Gate.io.
Cumulative Net flow
The first chart shows the cumulative net flow volume of stablecoins in wallets related to FTX exchange. The second chart depicts the same illustration but individiual tokens can be examined more closely. It should be noted that volume past 30 days ago is not included.
It can be seen that:
- The overall cumulative net flow has been positive until Oct 27.
- Since October 27th, the net cumulative flow has been negative, meaning that increasingly more funds have been transferred out of the wallet than have been transferred into the wallet since the previous 30 days.
- DAI has the lowest share in volume, therefore least impact on cumulative net flow.
- BUSD net flow has been negative since the beginning.
- USDT stayed positive until Nov 1st.
Since past 30 days, a cumulative total of nearly $500M has been transfered out of FTX and Alameda wallets.
Daily USD Tokens Flow
This graph shows the daily inflow as well as the outflow of wallets, the line chart shows the daily net flow on Ethereum.
- During past 15 days, daily volume has increased compared to first half of past month.
- In the first and second weekends (October 15, 16 and 22, 23), the volume has decreased significantly, but in the last two weekends, the volume has been higher. It probably means they've been working overtime to fix some issues!
It can be seen that recently the amount of both inflow and outflow volume has increased.
Token Flow Volume
The following chart depicts the Inflow and Outflow as well as Net flow of each token on Ethereum blockchain.
> All tokens have a negative net flow, which means that in the last 30 days, more volume has been transferred from wallets.
USDC with more than $5B of both inflow and outflow volume is the top stablecoin on FTX’s Ethereum wallets, followed by USDT.
🔎 Summary
The following key points can be drawn from our study:
- In Ethereum, the average daily inflow and outflow numbers were close to each other, so the net flow line was not too far from the center, on the other hand, in Solana, the outflow increased drastically in the last few days, resulting in a massive negative net flow.
- It can be seen that recently the amount of both inflow and outflow volume, on both blockchains, has increased.
- The flow volume in Solana is about one fifth of Ethereum.
- On both Ethereum and Solana top destinations and origins has been CEX platforms.
- On Ethereum chain, Coinbase with 38.7% of inflow volume is the top origin of funds. Binance is the top destination for funds, with more than 57% of funds going into it.
- On Solana, Gate.io is both top origin (with 89% of inflow) and top destination (with more than 59% of outflow).