BSC Free Square Question
Introduction and methods
Binance Smart Chain (BSC) is the blockchain that runs parallel to Binance Chain. In this case BSC is geared towards smart contracts, allowing decentralised applications to be traded on a permissionless platform.
No wonder Binance Smart Chain has been able to convince so many users in such a short time. After all, its advantages are immense.
- Independence: Binance Smart Chain is an independent blockchain that also operates separately from Binance Chain.
- High speed: BSC is characterised by extremely fast processes and uses the advantages of Binance Chain.
- Low transaction costs: Especially in comparison to Ethereum, BSC is much cheaper. This makes Binance Smart Chain a worthwhile option for developers and users.
- Compatibility: Binance Smart Chain is compatible with the Ethereum virtual machine and the corresponding Smart Contracts are also compatible with BSC. This also makes it easier for programmers to switch.
The network has been recently added to the Flipside Crypto database and now we are gonna try to explore the data in creative ways and show off some significant explorations with visualizations. The intention of this dashboard is to be creative and show what Flipside database can bring to the analytics and at the same time, trying to find some important BSC insights.
Then, after a deep exploration of the database, I am gonna show you the best analytics extracted from that. In principle, the metrics I have extracted from the database have been the following:
- Daily BSC transactions
- Cumulative BSC transactions
- Success vs failure transactions rate
- Daily BSC active users
- Cumulative BSC active users
- Average transaction fees
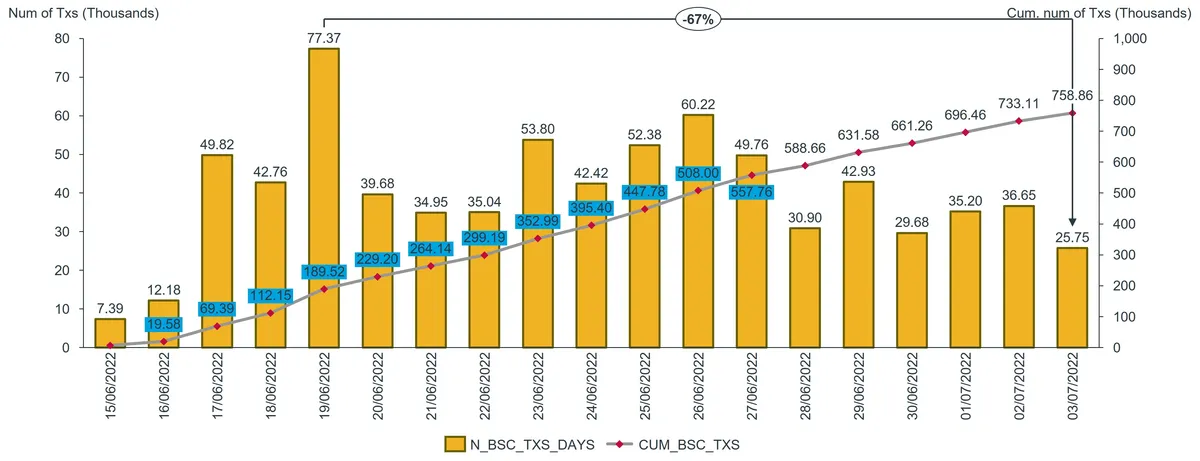

In this first charts we can explore the daily and cumulative number of transactions over time since the BSC data is available. As well, we can find the success vs failure rate evolution over these days.
Looking at the first metric, it can be seen how the daily transactions increased during the first days, but suddently dropped in June 20th. It increased again from June 23rd to June 27th but then decreased to the same June 20th levels. From that point, the amount of transactions seems to be similar. Looking at the cumulative transactions, it can be seen how it increased at a constant rate during the first days but the line become smoother during the last evaluated days.
Regarding the success and failure rates, the numbers look similar around 0.93 success transactions rate vs 0.07 failure rate.
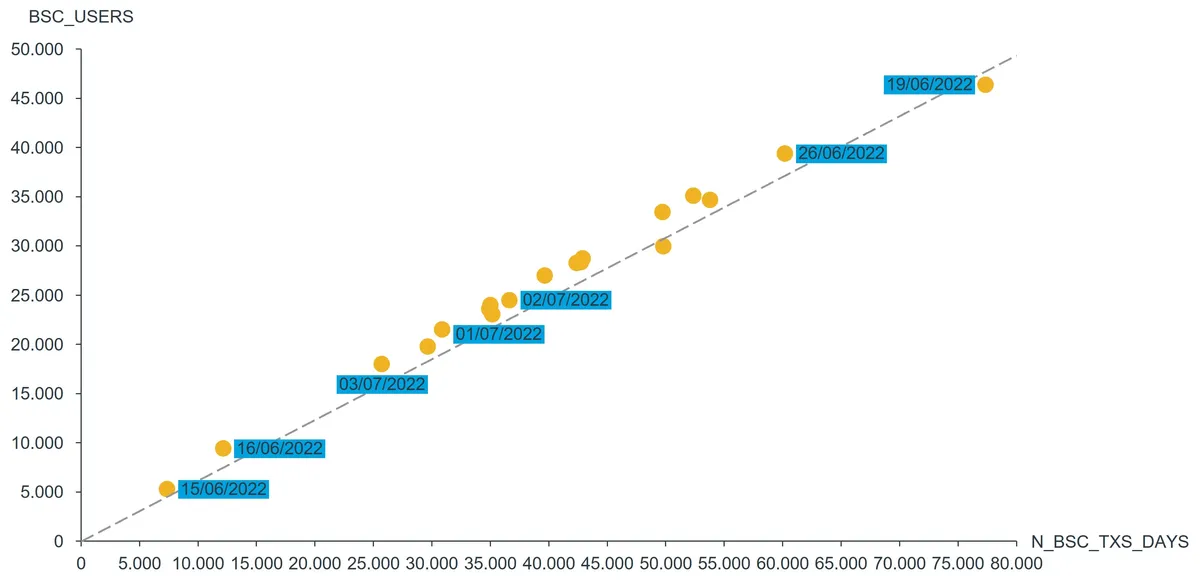
In the third chart, it can be found the correlation between the number of transactions and the number of active users in a daily basis. If we take a look at these metrics, we can see a beautiful strong positive correlation between them. When the number of daily active users is higher, there are more trasnactions done, and on the other way around. The highest values were registered in June 19th with more than 45k active users and a total of almost 80k transactions.
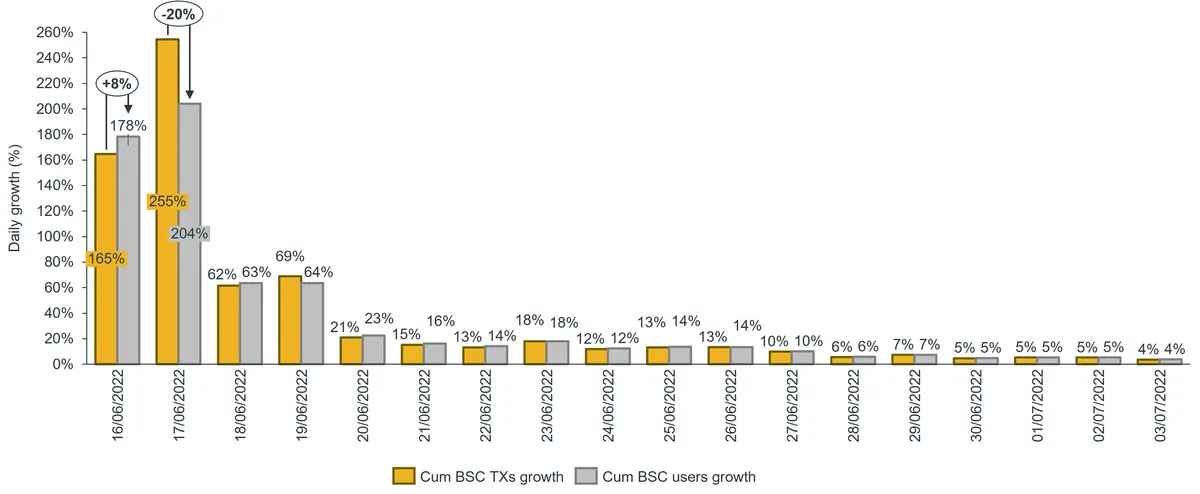
On the fourth chart, we can see these cumulative growths over time in order to get an overview of the percentage growth day by day over time. As said before, there is a correlation between these metrics and then, the same occurs with the cumulative ones. It can be seen how when one of these metrics grow, the other do the same. The major growht has been found during the first days. What it can be found is that during the first days the amount of users growht 8% more than the amount of transactions while in the second day, the amount of users increased 20% less than amount of transactions.
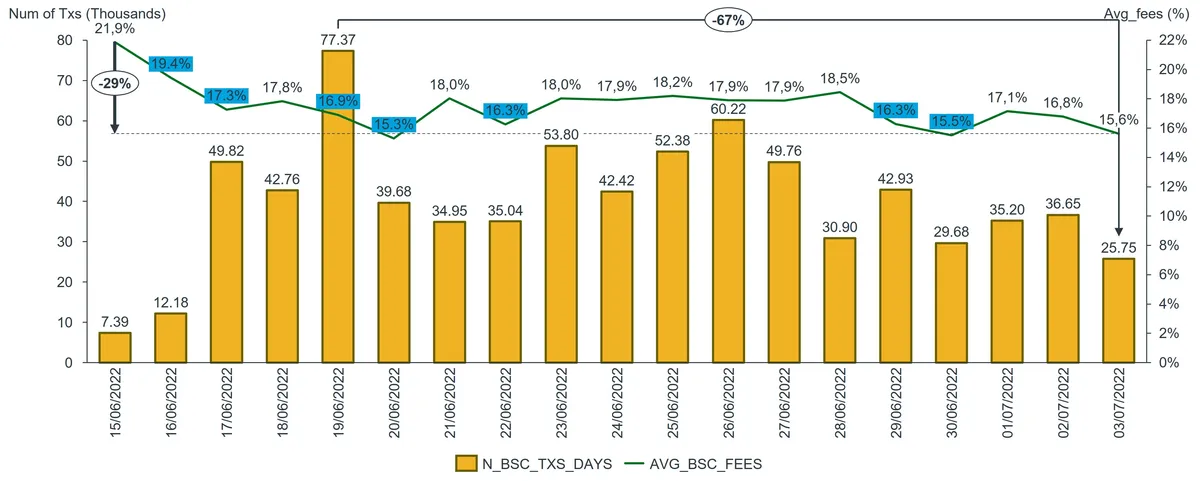
Finally, this last chart shows the daily transactions and the average BSC transaction fees over time in order to explore the congestion of the network and how expensive is.
As seen before, the daily number of transactions increased over the first days reaching the highest number in June 19th. From that point, the amount has decreased around 67% over the past days, passing from around 77k daily transactions to around 30k.
On the other hand, it sem slike there is no a significant correlation between the number of transactions and the average transaction fee. In this case, the average fees have decreased over time at a constant rate since the beginning, decreasing almost 22% since the beginning of the evaluation period.
Conclusions and insights
In this dashboard we have taken a deep overview of one of the new databases available on Flipside Crypto. Basically, we have focused our effort on the BSC network in several terms: transactions, users, fees and failure rates.
The main insights extracted from the analysis are:
- The daily transactions on BSC increased during the first evaluated days but have decreased over the past days.
- Regarding the success and failure rates, the numbers look similar around 0.93 success transactions rate vs 0.07 failure rate.
- There is a strong positive correlation between the daily transactions and the daily active users on BSC. When the number of daily active users is higher, there are more trasnactions done, and on the other way around.
- The average transaction fee has decreased over time at a constant rate since the beginning, decreasing almost 22% since the beginning of the evaluation period.
- There is no a significant correlation between the number of transactions and the average transaction fee.
Future works and possible improvements to the database
One of the main problem I have found to these new database is the lack of retrospective data. It would be fine to explore the daily new users coming to the network in order to explore the current increment rate, or maybe calculate the user retention rate. However, due to the data is only available from June 15th it is not possible to be computed. As well, another important point to contribute with is to get the top BSC wallets in terms of volume and try to detect the evolution of their wallets over time.