SushiSwap DEX Loyal Users
In this analysis, wallets using the SushiSwap DEX have been ranked by the number of trades and the number of days they used the DEX. Also, the users' behavior of this DEX has been evaluated.
SushiSwap is an automated market maker or as many called them, a decentralized exchange (DEX) which launched in September 2020 as a fork of UniSwap, the largest DEX on the market. As it is stated in SushiSwap's documentation, it is a community-driven entity with the aim to propose a solution for the "liquidity problem." SushiSwap's core products include a decentralized exchange, a decentralized lending market, yield instruments, and staking derivatives which are designed to maintain decentralized governance of SUSHI token holders.
SushiSwap is a non-custodial exchange which means unlike the centralized exchanges, does not hold tokens of its users. Alternatively, it lets users trade trustlessly using the liquidity that is supplied by others.
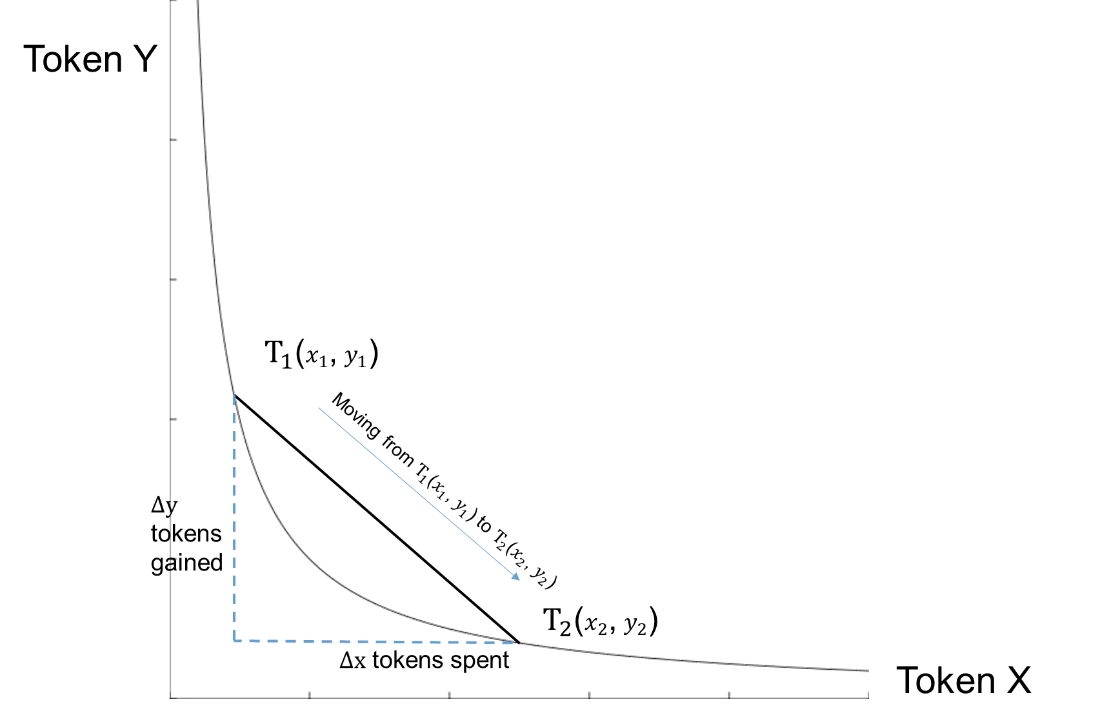
Token holders need to provide equal parts for a particular token (quote token) and its pair (ETH or a stablecoin). In exchange, they receive SLP tokens for their share of the liquidity pool. Other users can access this liquidity pool for a small fee which is distributed among the liquidity providers. Fluctuations in the price of two tokens of a provider, automatically recalibrate the quantity of those tokens to comply with the following equation:
>x*y=k
Where x and y are the quantities of the two paired tokens, and k is constant. In other words, even if you supply equal parts of two tokens to the pool, the quantities you receive when you reclaim your liquidity will change relative to the difference in the change in the price of the two tokens when you remove the liquidity.
For more information, you can check the official SushiSwap Documentation.
The required data was extracted from the ethereum_core.ez_dex_swaps table. The sender and block_timestamp columns was used as the wallets and date representatives, respectively.
To measure the users' behavior of the DEX, multiple indicators such as the number of unique users both daily and cumulatively, and the number of trades were compared over time and with each other.
For a deeper analysis, the interaction_time_interval indicator was calculated to measure the average time interval (in minutes) between each time a user has used the platform. Then, it was correlated to the number of trades and days the users have used the DEX.
Users' behavior of the DEX was analyzed since the launch of the platform.
For the wallets ranking, three time frequencies were used as follows:
- Last month: dates between 1 April 2022 and 30 April 2022;
- Year to date (YTD): dates since 1 January 2022;
- Since inception: all of the dates since the launch of SushiSwap (September 2020) up to today.
To measure the number of users coming back to the platform multiple indicators were calculated.
In the figure below, the number of unique users was measured both daily and cumulatively. As it is indicated in the chart, the cumulative number of unique users has increased steadily since the launch of the DEX. On the other hand, the number of unique daily users increased until the end of 2021. Since then, the trend stabilized with an average number of 150 new daily users. This can be incorporated into the overall crypto market downtrend and the decrease of interest in the space as a result.
Overall, the analysis of on-chain data has shown that SushiSwap's user base is increasing steadily over time, but it is heavily correlated to the overall crypto market. While the number of users increases, only a portion of them heavily use the platform in terms of both days and trades. Most of the users conduct their trades on the platform in intervals of less than 2 hours. In the periods of massive downtrends, the interest in the DEX decrease which results in lower trade numbers and a higher time interval between each consecutive user engagement.
In the figures below, the wallets using the SushiSwap DEX have been ranked by the number of trades they conducted during the specified periods. As it is demonstrated, the number of trades grows exponentially.
>Note: The charts are in logarithmic scale due to better visibility of the data.
In the following graphs, wallets have been ranked by the number of days which they carried out a minimum of one trade. It is demonstrated that a substantial number of addresses were active during the whole period since the beginning of 2022. In longer time frames though, the number of wallets with fewer active days is much higher compared to the wallets with more active days. It can be interpreted as either the number of new users increasing or the time intervals in which the users are conducting a swap on the platform getting wider.
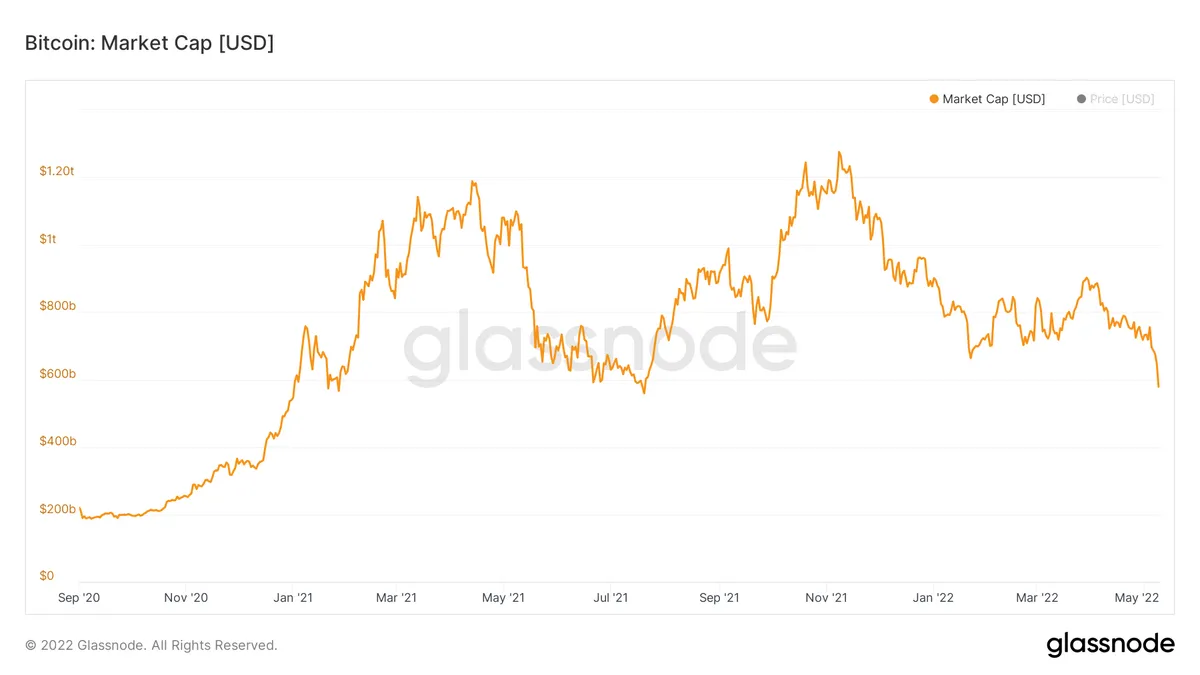
As a confirmation of the decrease in the interest in the platform, the daily number of trades was measured in comparison to the daily number of unique users. As it is shown in the following graph, the number of daily trades immensely decreased since late 2021 which coincides with the overall crypto market downward movement. On a general view, the trend of trades is similar to the crypto's total market cap which again indicates that users' tendency towards using the SushiSwap DEX is affected by their affinity to use crypto as a whole. >Note: bitcoin's market cap chart is included from Glassnode for further comparison since its pattern is analogous to the total crypto market cap.
As mentioned previously the interaction time interval was measured to demonstrate the average time interval between two consecutive times which a user had used the DEX in minutes. In other words, it is an indication of user engagement by measuring the time between each interaction with the platform.
In general, a lower value in interaction time interval indicates that a user has been using the DEX multiple times through the period, thus the interval between its usages decreases. On the contrary, if the number of usages decreases, the interval between them increases, therefore the interaction time interval will increase.
In the first two figures below, the interaction time interval of all of the users is plotted over time with the number of users and trades as the bubble size, respectively. In the first chart, it can be seen that over time, as the number of users increases, their interaction time interval has increased too. The second chart though demonstrates a direct correlation between the number of trades and the interaction time interval with the growth of the overall crypto market. As it can be seen, in the second half of 2021 when the crypto market was at its peak, the trade numbers increased and the interval decreased which indicates a high user engagement. On the hand, both of these indicators have declined since the beginning of 2022 as the market has moved to the downside.
In the last two figures, the number of users and trades were plotted over the interaction time interval for the whole period from the same dataset, interchangeably. The first figure demonstrates that the majority of users with a high number of trades interact with the platform roughly every 7 to 15 minutes. Most of the heavy engagements on the platform occur between 5 to 50 minutes periods. The second chart shows that the majority of trades occur in intervals of more than 10 minutes. Both the interval time and the number of trades increases in a linear correlation with the number of users.