ETH Down Bad
The price of Ethereum has sank in recent days - how does it compare to other tokens amid a general market downturn? Can you find evidence of any potential causes for ETH's struggle? Are there any other indicators that could help us predict whether/when it could recover?
Information and base of ETH Down bad
==3 min read==
Ethereum has slipped over 7% on the day as the attacker who purportedly drained FTX wallets dumped a significant portion of their accumulated ETH and traded it for Bitcoin.
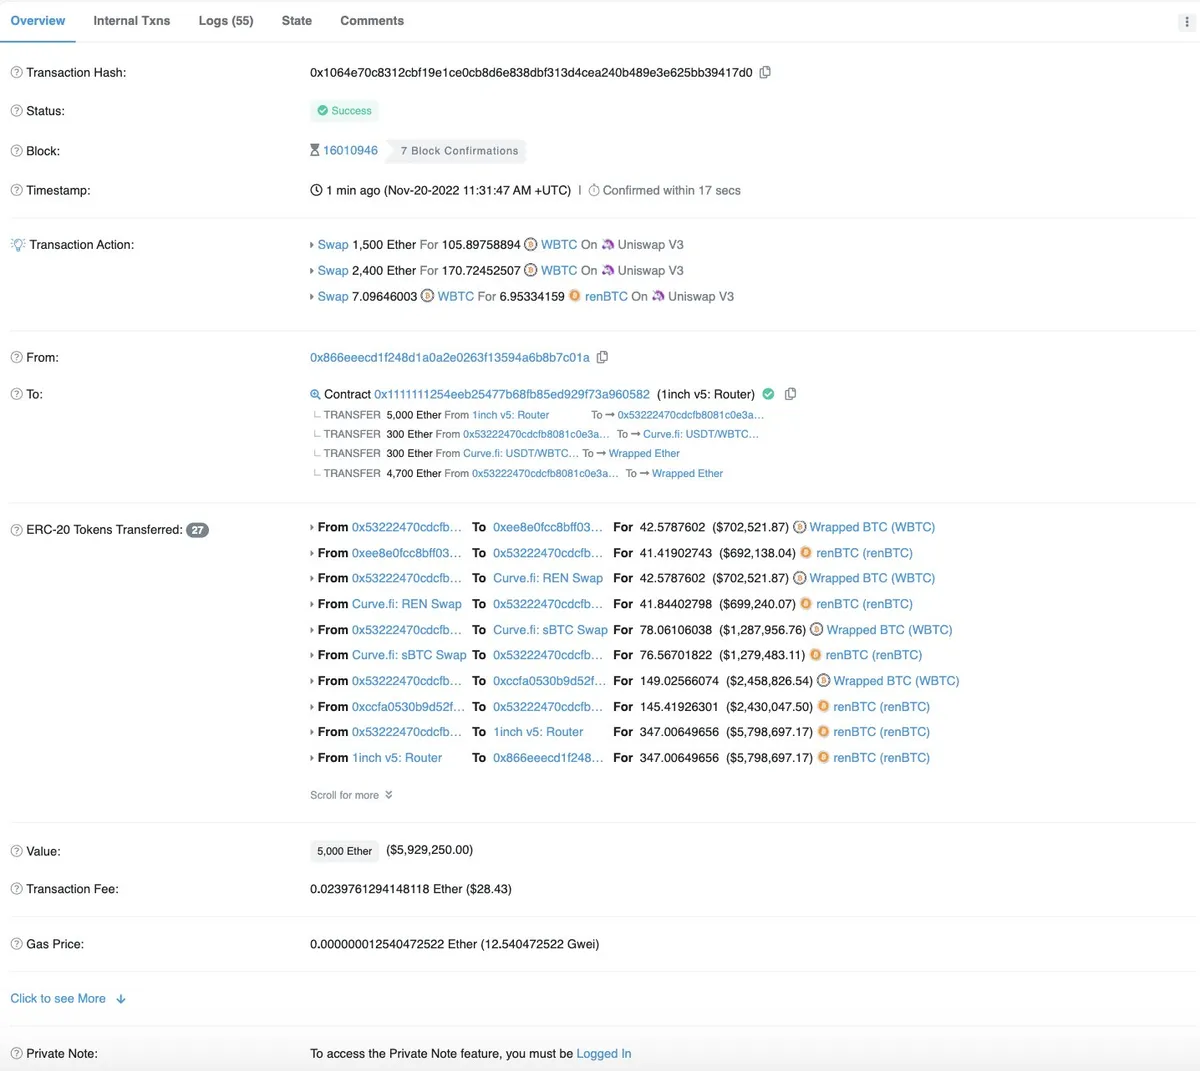
Over the weekend, per blockchain tracker PeckShieldAlert, the exploiter swapped thousands of ETH for renBTC, a form of wrapped Bitcoin, before swapping the resulting tokens for Bitcoin. According to data from Etherscan, the on-chain Ethereum holdings of the "FTX Accounts Drainer" dropped 26% from 250,735 to 185,735 over the same period. #PeckShieldAlert FTX Accounts Drainer 0x866e...01a has swapped ~5k $ETH ($5,929,250.00) for 347 $renBTC ($5,798,697.17) pic.twitter.com/fLYC2oR4eV
— PeckShieldAlert (@PeckShieldAlert) November 20, 2022
The resulting price pressure has seen Ethereum drop by over 7% in the past 24 hours, according to data from CoinGecko.
On Sunday, Ethereum broke the $1,200 barrier, trading as low as $1118.64, a new weekly low for the cryptocurrency. At press time, ETH trades at around $1,117, with weekly losses of over 8%. Since the start of 2022, ETH has lost nearly 75% of its value. Despite the drop in ETH’s price, the Ethereum-based NFT market has remained constructive, with NFT sales volume growing over 16% to $9.3 million over the past 24 hours, per data from Cryptoslam.
According to DefiLlama, the total value locked (TVL) across all decentralized applications (dapps) on Ethereum is down over 4% to $23.8 billion, indicating a reduction of DeFi activity during the bearish market movement. According to data from Coinglass, $40 million worth of Ethereum futures trades were liquidated over the past 24 hours. Of the total liquidations, the majority of them (85.98%) were long trades. Crypto market sheds billions The fallout from the collapse of crypto exchange FTX has seen cryptocurrency losses extend, driving the market into deep red territory.
Over the past day, the total market cap of all cryptocurrencies has slipped by over $30 billion to $832 billion, a drop of over 4%, according to data from CoinGecko.
Per CoinGecko, Bitcoin (BTC) plunged to a new weekly low of $15,976 earlier today. After staging a modest recovery, at press time, Bitcoin is changing hands at around $16,080, down 3.6% over the past 24 hours.
Nearly $71 million worth of Bitcoin futures positions were liquidated over the past 24 hours, per data from Coinglass. Of the $76 million liquidated, over 90% (around $64 million) were long trades. Following the day’s bearish price momentum, Bitcoin is down over 76% from its all-time high of $69,044 recorded in November 2021, with the market capitalization of Bitcoin plunging from $1.27 trillion last November to under $308 billion today.
Other top 10 cryptocurrencies have also posted losses over the past 24 hours, with Dogecoin down 10%, XRP down 8.9% and Cardano down 7%.
this information is related for three days ago(Nov 21, 2022)

Concluding
- ERC20 token price had Downward Trends .After 9 Nov 2022(FTX collapse date) ERC20 tokens has changed 180 degrees and has become completely negative.
- We can see the ETH price is currently relase as all moving average trend lines.
- All of analyzed tokens price drop after 8th November (FTX collapse day) and still dropping.
- At 10 NOV we have lowest net flow of last 30 days, that day is exactly the day after collapse of FTX day.
- We check a lot of parameters, and it is obvious that FTX collapse still have negative impact in all cryptocurrencies.
- There was dramatical increasing swap activity on both Uniswap and Sushiswap during and after FTX & Alameda Collapse especially in volume.
- The share of high-volume transactions ==(more than 1000 USD)== has also increased significantly during the collapse timespan.
- on both platforms, There was increasing activity of swaps FROM stablecoins especially in terms of volume since 8th November till 12th November. But suddenly on 12th November, There was quite increasing share of swaps TO stablecoins. So, we can conclude that users were swapping their stablecoins into other assets which have experienced massive drop in their price in order to buy them at the dip, but then on 12th November and when the assets’ price has almost recovered, traders again swapped their assets to the stablecoins. This similarity between both platform's traders is interesting
- Totally, stablecoins have experienced massive growth in their swaps (especially on Uniswap) during the FTX & Alameda collapse and the share of swaps with other tokens (non stablecoins) during collapse timespan was ==less than days and weeks before that.==
- The average pools balance of both Uniswap and Sushiswap has decreased significantly during the collapse timespan and this can be because users lost their trust and also hope from the cryptocurrency platforms even decentralized exchanges!
- The impact of FTX & Alameda collapse on Sushiswap's volume (almost 2.5x more than previous days) was more than Uniswap ==(almost 2x more than previous days).==
- As time goes on, The number and especially volume of swaps from SOL to other tokens is increasing significanlty meaning that users are losing their trust in this token and prefer to swap out it to other tokens.
- most number of both inflow and outflow of Solana tokens from/to CEXs were done with $10 - $100 volume. In terms of SOL token, we can see the majority of deposits and withdrawal to the CEXs were done with 1 - 10 SOL volume.
According to all the research we had and the analyzes we did and the references we used, we realized that all the currencies have been strongly affected without any doubt and this effect is still continuing, but I hope that this effect will decrease in the coming days. come to an end and return to the previous routine

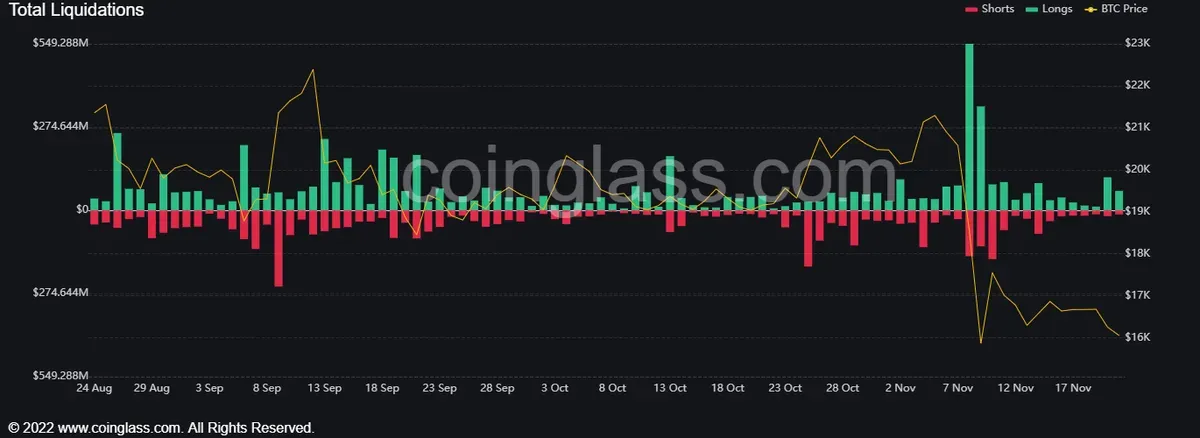
above photo is about Ethereum Total liquidation.
left photo is about BTC Total liquidation.
the increasing share of Stablecoin pools swaps during and after collapse timespan is clearly visible on the left charts.
And on the left chart, we can see the average tokens’ balance of Uniswap pools has decreased significantly during the collapse timespan and this is because maybe traders have lost their trust in crypto protocols even a decentralized exchange like Uniswap
Based on the above charts, the majority of assets were transfered out of FTX on 12th November while the main outflow was started since 7th November (1 day before the main market price crash).
About CEXs, we can also see the highest spike of outflow volume from these platforms on 12th November. Moreover, yesterday (18th November) we can see another high spike of both inflow and outflow from to CEXs.
In terms of SOL, we can see the majority of inflow and outflow of this token has achieved on 11th November and it has started mainly after 8th November.
After and before these days, we can see way less activity of SOL deposits and withdrawal to/from CEXs.
Totally, we can see the negative net flow of SOL token in majority of days meaning that most number of transfers are from Solana ecosystem to the CEXs.
Based on the left charts, we can see that most number of both inflow and outflow of Solana tokens from/to CEXs were done with $10 - $100 volume.
In terms of SOL token, we can see the majority of deposits and withdrawal to the CEXs were done with 1 - 10 SOL volume.