EVM - 4. The “Flippening” Comparison
Optimism+Arbitrum vs. Ethereum
Optimism vs. Arbitrum
Total and Average Transaction Details
- The number of transactions and active users on Optimism during the past 90 days was less than Arbitrum. Moreover, the average and total generated fees on Optimism are higher than those on Arbitrum, which is a drawback for this chain.
- Also, we can see that the success rate of transactions on optimism (95.76%) is kind of lower than that on Arbitrum(97.276%).
- Furthermore, we can see that the average number of transactions per second on optimism is lower than that of arbitrum.
- Based on the above charts, an average Arbitrum user performs more transactions than Optimism users, but pays less fees!
Daily Transaction Details
- The above charts show that Optimism's transaction and user count has been gradually increasing over the past 90 days, and it has recently passed Arbitrum, which may be good for this chain but leaves it behind Arbitrum in terms of transaction volume.
- Arbitrum had more transactions per second (TPS) than Optimism until the beginning of 2023. Since then, and because of the Optimism NFT Quests, Optimism has passed Arbitrum in this regard.
- Optimism's daily total and average fees are higher than Arbitrum's, and they have started to increase since the beginning of 2023, but they are still lower than the amount of fees on November 8.
- However, Arbitrum's transaction success rate is higher than Optimism's, but still, the amount of fluctuation on Arbitrum is greater than on Optimism.
- Finally, in the case of transactions per user, on most days Arbitrum has the lead.
New User Details
- On most days, new users on Arbitrum outnumber new users on Optimism, also can be seen using the cumulative number of new users where Arbitrum has the lead.
- Since mid-December until the beginning of 2023, there has been a sudden increase in the number of new users on Optimism, so on December 31, it reached about six times more than Arbitrum.
- Also, in the case of average number of new users per day Arbitrum is greater than Optimism.
Daily NFT Sale Details
- Based on the above charts, optimism is developing really fast and satisfyingly in the NFT sales ecosystem.
- On Optimism, the number of NFT sales, active buyers, and active sellers has been going up and recently they are greater compared to the amounts on Arbitrum.
- The NFT sales volume on Optimism are fluctuating and doesn’t have a complete lead on Arbitrum on the daily basis, but still it has dominance over Arbitrum in the cumulative chart.
NFT Buyer Details
- As can be seen, the number of active new users with more than 1 transaction on Optimism was higher than Arbitrum recently, and has reached its highest point in the ending days of 2022.
- Also, the recent number of active new users performing transactions on two or more distinct days has spiked in the recent week on Optimism while they were decreasing on Arbitrum during the same period.
- This significant number and high percentage of new users interacting on Optimism, indicate an upward trend in the adoption of NFT activities on this network.
- According to charts of cumulative NFT interactors and new NFT buyers, Optimism and Arbitrum have grown in the last 3 months compared, but the growth on Optimism is much faster than Arbitrum.
Daily and Total Bridge Details
- In terms of the number of bridge transactions, optimism has been increasing over the last 90 days, while bridge volume has been fluctuating.But for Arbitrum, both the number and volume of bridge transactions have decreased over the past three months.
- In terms of total number of bridge transactions, optimism leads, while Arbitrum leads in terms of volume of bridge transactions.
Swap Transactions
Daily and Total Swap Details
- According to the above charts, there is an increasing trend for swap transactions on Optimism, and the number of swappers on this chain is also increasing, so it will have passed Arbitrum by the beginning of 2023.
- The growth rate of Optimism swaps and swappers is higher than that of Arbitrum, and this can be a good sign for this chain and provide hope for a bright future in swap activity.
- Also, the total number of swap transactions on Optimism is less than Arbitrum, just as the total number of active swappers and volume of swap transactions over the past 90 days indicate.
- The average daily fees generated by Optimism transactions are higher than those generated by Arbitrum swaps, while the average swap volume on Optimism is lower than that on Arbitrum.
Block Production
Overall Transaction Details
- Althought, one some days the combined number of transactions on Arbitrum and Optimism surpassed the number of the transactions on Ethereum, but in the last 90 days is the total number of transactions on Arbitrum and Optimism is lower than the Ethereum.
- There are about 13.96 million active users on Ethereum, which is more than 7 times bigger than the total number of combined users on Arbitrum and Optimism which is about 1.95M.
- The daily number of transactions per user on Ethereum is about 4 times more than the combined number of transactions per user on Optimism and Arbitrum.
- As you can see, Ethereum's total fee is significantly higher than the total fee in L2S networks.
Daily and Total Block Production Details
- According to the above charts, we can see an increasing trend in the number of produced blocks on Optimism over the past 90 days, and this can be a good point for this chain, while the number of produced blocks on Arbitrum was constant and decreasing in some parts.
- Also, we can see there is more block production activity on Optimism than on Arbitrum, which shows the smaller size of Optimism blocks compared to Arbitrum because there are fewer transactions in blocks.


Transactions
New Users
NFT Sales

Bridge from L1

A review of what we had during this dashboard
- In the last 90 days, Arbitrum and Optimism have had fewer combined transactions than Ethereum, but recently, Optimism and Arbitrum have officially surpassed Ethereum in combined transaction volume. Ethereum has 13.96 million active users, more than seven times the 1.95 million combined users of Arbitrum and Optimism. Ethereum has four times the daily transactions per user of optimism and Arbitrum. Ethereum's total fee is much greater than L2S's.
- Optimism's transaction and user counts have been gradually expanding over the past 90 days, and it recently passed Arbitrum, which may be excellent for this chain but leaves it behind in transaction volume. Until 2023, Arbitrum had more TPS than optimism, but because of the NFT quests, Optimism has surpassed Arbitrum since then. Arbitrum's transaction success rate is higher than Optimism's, but its fluctuation is bigger. Arbitrum leads in transactions per user most days. Optimism has fewer 90-day transactions and active users than Arbitrum. Optimism's average and total produced fees are higher than Arbitrum's, which hurts this chain. Also, Optimism has a lower transaction success rate (95.76%) than Arbitrum (97.276%). Optimism has fewer transactions per second than Arbitrum. According to the charts, Arbitrum users make more transactions than Optimism users but pay less!
- Arbitrum has a higher cumulative number of new users than Optimism on most days. Optimism gained six times more new users than Arbitrum between mid-December and the start of 2023. Arbitrum exceeds Optimism in average daily new users.
- Optimism now has more NFT sales, active buyers, and active sellers than Arbitrum. Optimism's NFT sales volume fluctuates every day but dominates Arbitrum in the cumulative figure. Optimism has more NFT sales, sellers, and buyers than Arbitrum. Arbitrum sale volume is far more NFTs than Optimism. Optimism has more active new users who have made more than one transaction than Arbitrum does right now. This trend peaked in late 2022. In the past week, there were more active new users on Optimism who traded for two or more days, but there were fewer on Arbitrum. Optimism's large number and high percentage of new users show an increased trend in NFT adoption. Optimism has grown faster than Arbitrum in the last three months, according to cumulative NFT interactor and new NFT buyer charts.
- Over the past 90 days, optimism has grown as bridge transactions have fluctuated. Over the past three months, Arbitrum's bridge trades have declined. Optimism leads in total bridge transactions, while Arbitrum leads in volume.
- Optimism will overtake Arbitrum by 2023 due to its rising swap transactions and swappers. Optimism Swaps and swappers are growing faster than Arbitrum, which bodes well for the future of this chain and swap activity. Optimism has fewer swap transactions than Arbitrum, as shown by its total number of active swappers and 90-day swap volume. Optimism swaps have lower swap volumes than Arbitrum swaps but higher average daily rates.
- Over the past 90 days, Optimism's block production has gone up, which is good for this chain, while Arbitrum's has stayed the same or gone down. Optimism makes more blocks than Arbitrum, which means that its blocks are smaller because there are fewer transactions.
Coclusion
A short glance of what we will have during this dashboard
- It finally happened. The great flip everyone’s been waiting for, Optimism and Arbitrum have officially surpassed Ethereum in combined transaction volume.
- In this dashboard, we will try to use this historic event to compare and contrast these two major L2 chains.
- For this, we will compare optimism vs. arbitrum in the following ways:
- Optimism+Arbitrum vs. Ethereum
- Overall Transaction Details
- Optimism vs. Arbitrum
- Transaction Details
- New User Details
- NFT Sales
- Bridge from L1
- Swap Transactions
- Block Production
- Optimism+Arbitrum vs. Ethereum
Note that by default, the timespan has been set for the past 3 months (90 days), but you can change the timespan using the parameter provided above to show the results for your desired timespan.
Credits and References
Dashboards
- OPtimitic or Pessimistic? by Ali3N
- OPtimitic or Pessimistic? by 0xHaM-d
- OPtimitic or Pessimistic? by tongzzez
Photos
- Cartoon photos
- Introduction (Ethereum photos)
- Introduction (Optimism photo)
- Introduction (Arbitrum photo)
\n
Methodology
What is layer 1?
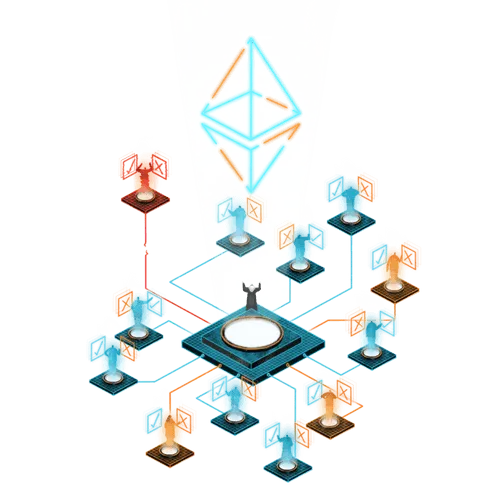
Layer 1 is the base blockchain. Ethereum and Bitcoin are both layer 1 blockchains because they are the underlying foundation that various layer 2 networks build on top of. Examples of layer 2 projects include "rollups" on Ethereum and the Lightning Network on top of Bitcoin. All user transaction activity on these layer 2 projects can ultimately settle back to the layer 1 blockchain.
Ethereum also functions as a data availability layer for layer 2s. Layer 2 projects will post their transaction data onto Ethereum, relying on Ethereum for data availability. This data can be used to get the state of the layer 2, or to dispute transactions on layer 2.
Ethereum as the layer 1 includes:
- A network of node operators to secure and validate the network
- A network of block producers
- The blockchain itself and the history of transaction data
- The consensus mechanism for the network
Source
What is layer 2?
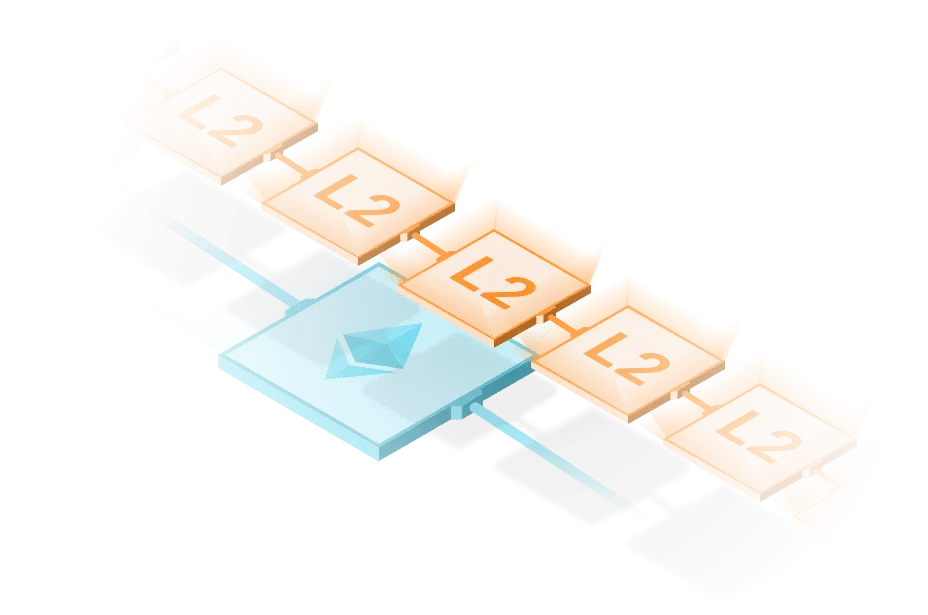
Layer 2 (L2) is a collective term to describe a specific set of Ethereum scaling solutions. A layer 2 is a separate blockchain that extends Ethereum and inherits the security guarantees of Ethereum.
Now let’s dig into it a bit more, and to do this we need to explain layer 1 (L1).
Why do we need layer 2?
Three desirable properties of a blockchain are that it is decentralized, secure, and scalable. The blockchain trilemma states that a simple blockchain architecture can only achieve two out of three. Want a secure and decentralized blockchain? You need to sacrifice scalability.
Ethereum has reached the network's current capacity with 1+ million transactions per day and high demand for each of these transactions. The success of Ethereum and the demand to use it has caused gas prices to rise substantially. Therefore the need for scaling solutions has increased in demand as well. This is where layer 2 networks come in.
Scalability
The main goal of scalability is to increase transaction speed (faster finality) and transaction throughput (higher transactions per second) without sacrificing decentralization or security.
The Ethereum community has taken a strong stance that it would not throw out decentralization or security in order to scale. Until sharding, Ethereum Mainnet (layer 1) is only able to process roughly 15 transactions per second. When demand to use Ethereum is high, the network becomes congested, which increases transaction fees and prices out users who cannot afford those fees. That is where layer 2 comes in to scale Ethereum today.
Source
How does layer 2 work?
As we mentioned above, Layer 2 is a collective term for Ethereum scaling solutions that handle transactions off Ethereum layer 1 while still taking advantage of the robust decentralized security of Ethereum layer 1. A layer 2 is a separate blockchain that extends Ethereum. How does that work?
A layer 2 blockchain regularly communicates with Ethereum (by submitting bundles of transactions) in order to ensure it has similar security and decentralization guarantees. All this requires no changes to the layer 1 protocol (Ethereum). This lets layer 1 handle security, data availability, and decentralization, while layer 2s handles scaling. Layer 2s take the transactional burden away from the layer 1 and post finalized proofs back to the layer 1. By removing this transaction load from layer 1, the base layer becomes less congested, and everything becomes more scalable.
Rollups
Rollups are currently the preferred layer 2 solution for scaling Ethereum. By using rollups, users can reduce gas fees by up to 100x compared to layer 1.
Rollups bundle (or ’roll up’) hundreds of transactions into a single transaction on layer 1. This distributes the L1 transaction fees across everyone in the rollup, making it cheaper for each user. Rollup transactions get executed outside of layer 1 but the transaction data gets posted to layer 1. By posting transaction data onto layer 1, rollups inherit the security of Ethereum. There are two different approaches to rollups: optimistic and zero-knowledge - they differ primarily on how this transaction data is posted to L1.
What is Optimism?
Optimism is a fast, stable, and scalable L2 blockchain built by Ethereum developers, for Ethereum developers. Built as a minimal extension to existing Ethereum software, Optimism’s EVM-equivalent architecture scales your Ethereum apps without surprises. If it works on Ethereum, it works on Optimism at a fraction of the cost.
Source
What is Arbitrum?
Arbitrum is a technology suite designed to scale Ethereum. You can use Arbitrum chains to do all things you do on Ethereum — use Web3 apps, deploy smart contracts, etc., but your transactions will be cheaper and faster. Our flagship product — Arbitrum Rollup — is an Optimistic rollup protocol that inherits Ethereum-level security.
Source


Introduction