Solana NFT Project Feature
I defined whales as the top 500 wallets with the most sales amount.
The note-worthy point we can understand from the below chart is that from 500 whales, only the maximum number of 8 whales interacted with this project.
We can easily find the top 20 purchasers from this pie chart.
The noteworthy point is that a single wallet is responsible for more than 60 percent of sales.
With their accessibility-oriented design, the monkeys' goal is to invade the blockchain and spread their community.
The monkeys feature owner-exclusive advantages such as NFT ownership, as well as a community wallet useable by holders with a future on-chain voting system. The Solana Monkeys' metadata is stored on Arweave, a permanent decentralized data storage. Each monkey is generated from over 99 possible traits spread over 6 layers, with some monkeys being rarer than others. Reject humanity, return to monke.

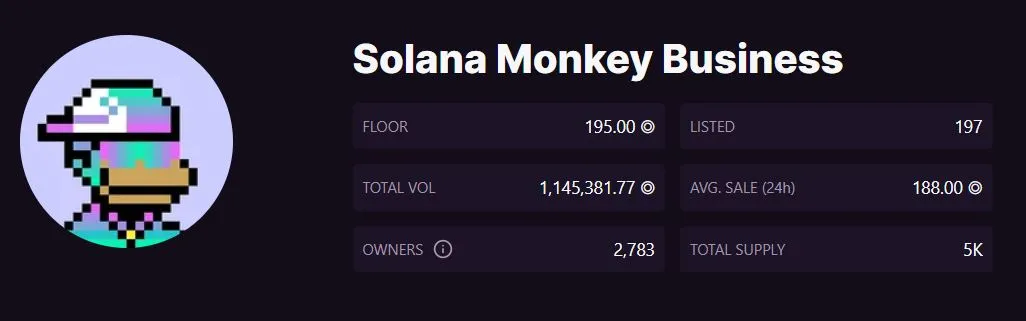
In this dashboard, I am going to choose the Solana Monkey Business as a NFT project from the list and create a dashboard with the new Flipside dashboard layout that can refresh once a day highlighting at least 4 metrics that helps show the "health" of the project.
And also I will try to note any noticeable trends or current events for the project and highlight how liquidity is flowing in and out of the project and what types of buyers and sellers are interacting with the project.
My goals in this dashboard is to:
- Drawing daily sale amount chart.
- Drawing average sale amount
- Drawing total sale amount and average sale amount chart and comparing them on chart.
- Drawing daily users chart
- Drawing cumulative users chart
- Drawing pie chart of top 20 purchasers
- Drawing whales chart in case of unique users and sale amount
- Drawing new users chart in case of unique users and sale amount
From the above chart, we can see the daily sale amount of this project, and it's evident that the project's popularity has increased, and it had a maximum sale amount on May 7, 2022, with 65K sales.
In the case of the average sale amount, we have a uniform increasing pattern since the mint date except for some days like December 26 and March 13 we had maximum amounts.
From the chart above, we can reconfirm what we mentioned in previous charts.
In the unique users chart we see the same pattern with average sale amount. We have a unique increasing pattern from the mint day and the maximum number is on June 17 with 53 users.
If we compare the new users and whales chart, we notice that this project was more prevalent among new users than the whales in the case of sales amount and number of unique users.
Conclusion
In this dashboard, I choose the Solana Monkey Business as an NFT project from the list and create a dashboard with the new Flipside dashboard layout that can refresh once a day, highlighting at least four metrics that help show the "health" of the project. And also tried to note any noticeable trends or current events for the project and highlight how liquidity is flowing in and out of the project and what types of buyers and sellers are interacting with the project.