SOL Swaps on Jupiter

first question Since January 1st, how much SOL has been swapped for other tokens using Jupiter per day? we according hint in question and assumption we just sum amount of tx that swapped sol to every thing else ( even sol 😉) so just grouped them together and sum valume and tx count and draw them at chart bellow
another day and another Solana bounty🎉 let's go
Assumptions
- to find how much Solana SwapAway just need add
SWAP_FROM_MINT = 'So11111111111111111111111111111111111111112'to condition - to find how much Solana SwapTo just need add
SWAP_To_MINT = 'So11111111111111111111111111111111111111112'to condition - TX must be done successfully
- some of tx have same
SWAP_To_MINTandSWAP_FROM_MINT - so far just info about Jupiter Swap provided in Solana Swaps table so I don't added more condition to filter just Jupiter swap to boost query performance
next question Over the same time period, how much SOL has added from swaps using Jupiter per day? like pervious question with this diffrence instead from we sum to SOL swaps
next I added new information to compare SwapAway and SwapTo to better show diffrence
this chart compare tx the swap sol to another token(even Sol) and another token(even Sol) to Sol.
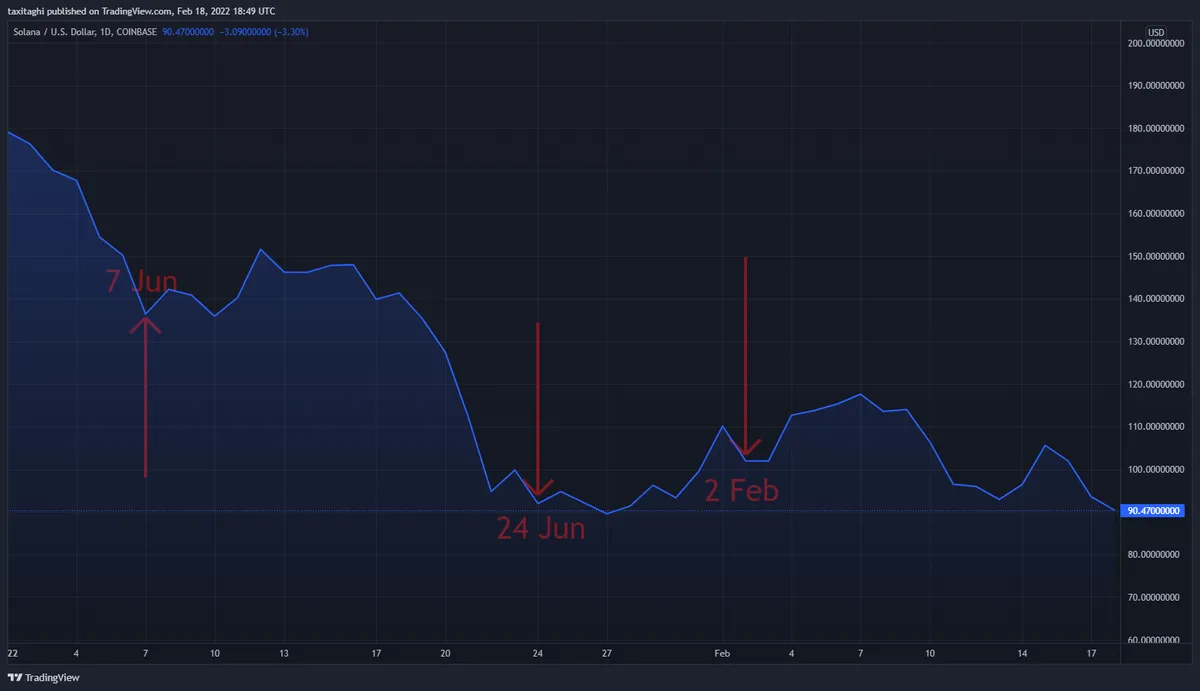
last question provide insights around any spikes you see. to solve this question I think when people sell Solana Price dump. So to verify This theory ( truth) in three days Jun 7 and Jun 24 and Feb 2 we have three spike and so I Highlight them with arrow so pleas look at each one separately(I provide TradingView for see Price in each day and also provide diff buy and sell Solana chart to compare them):
- at Jun 2 we have A dip in TradingView chart according chart SwapAway Vs SwapTo amount of SwapAway(from) is more so price should dump and we see a dip in trading view chart
- at Jun 24 we have A dip in TradingView and same thing happened On the amount of swapAway
- last big spike also happened in Feb 2 where We Also see A big dump in TradingView SOL price chart
one of best chart for consolation in cumulative chart. we see amount of SwapAway is much more Than SwapTo so Price is dumping (that we see in TradingView chart).but wiered thing is SwapTo chart has more TX and this show seller has more Solana than buyer.