TVL Sushi vs. Uni
TVL Sushi vs. Uni
this bounty about TVL Sushi vs Uni. so start with, what is Sushi's (or Uni) TVL? I define it is as total value of each LP-token in sushi. for example if we have sushi-WETH LP token, TVL define as total amount(USD) of sushi and WETH in this contract this is TVL of sushi-WETH LP, but what is TVL SushiSwap? this define as TVL all LP token in SushiSwap.
Start with SushiSwap TVL: as you in code I started to find what LP there is in sushiswap and filter them then find amout according USD for each one for each day as (example for sushi-WETH find amount WETH and sushi in this contract and sum them - usualy amout of USD for both are equal as rolls of Pools - then sum with TVL other lp. after repeat this job for each day from 90 day ago.
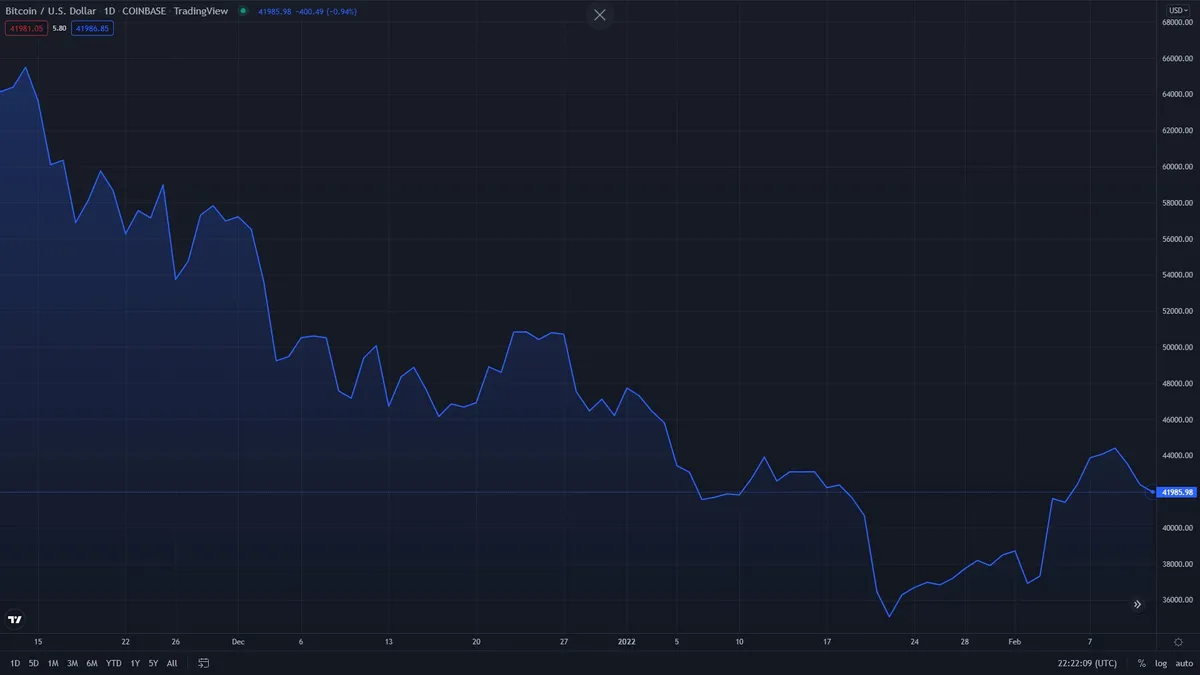
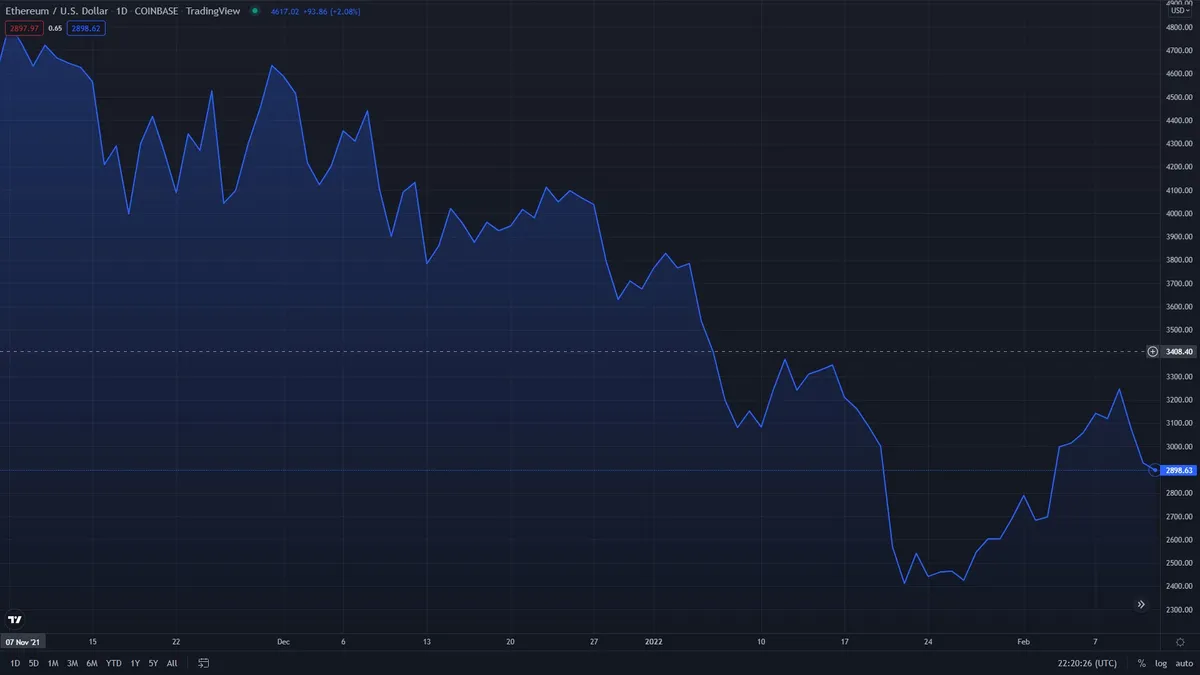
we can also comparison TVL chart with ETH and BTC. we clearly see all of this have a similar pattern in general ( this prof my chart correctness 😅 - please read this article to the end )
at second step i calculate UniSwap V2 and V3 TVL like SushiSwap.
for better understanding I try change scale from linear to log. now chart is better BUT look at number of TVL in some days like Jun 2, 2022. TVL of UniSwap is 2000x of TVL of whole of crypto market. are you kidding me??????????
There is Some Thing Wrong and Should find It. So Let's Start new Journey
I just change platform name to uniswap-v2 and v3 to find LPs and next search to find amount USD and grouping balance together according days and next sum TVL in each day. after run query and get result try to draw chart. but chart looks amazingly wrong!
(continue in next paragraph)
as Start I go to UniSwap and SushiSwap info page to find out how much is TVL and get Idea how much change TVL in last couple days? I use this
after this I find out we don't see LPs more than 500,000,000% TVL and even find out Worst Pool that shows in UniSwap has more than 55,000 USD TVL (just 1,800$ Vol in last 7d) so I think It is better to add some filter. but before that let's just run query to find out witch tokens has more 500,000,000% TVL
After search and look at explorer of some of this Account I know usually they create a LPs Token with a scam token after that they create a swap transaction with high price for scam token after that price of token shows high while token don't have value.
so can't run query without filtering these scam(shit) coin. as describe before this filters are:
- amount of USD for each token in LP token account less than 500m$
- amount of USD for each token in LP token account greater than 50k$ ( for this or less value this just boost query performance and we can consider this account as token's haven't active development and pool in this platform)
- flag has price must be true
after adding this filters and running query again, now daily TVL make sense and data is reliable.
Now is the time to compare
Line Chart: this chart have simple and much cleaner at first look and we can easily see downfall in TVL (except for UniSwap v3).one problem I see in this chart is about 26-30 Jun while there isn't any information but chart shows a straight line that connect last info before have info to first day after have info for TVL.
Time Series Animation Chart: last chart and my favorite chart. This chart shows day by day TVL as animation and you can easily see change over the time. for example in chart we can see how UniSwap V3 beat SushiSwap.
for each section bellow I have two chart.
-
shows SushiSwap vs UniSwap (v2+v3)
-
SushiSwap vs UniSwap v2 vs UniSwap v3
notice 1: for 26-30 Jun there isn't any information in erc20_balances so we see gap in bar chart or straight line in line chart
notice 2: if you want to see line and bar chart just for SushiSwap or UniSwap V3 you can just click on name of other project at legend in top right, this make other project hide and see just one project
Bar Chart: first charts that I want to show is bar chart. we can easily change over time and see TVL in each day but but the large number of days has caused the chart to become congested and maybe confused you at first look.
Conclusion: in last 3 month about all crypto market lost prices, so TVL of pools dropped except UniSwap V3 did not change and remained constant but SushiSwap TVL, it was halved.
The purpose of this dashboard :
- Find SushiSwap TVL in last 90 days
- Find UniSwap TVL in last 90 days
- Find new to remove Scam token from TVL data
- show some scam token with fake TVL
- Compare SushiSwap vs UniSwap V3 vs UniSwap V2 TVL in last 90 days
- Compare SushiSwap vs UniSwap (V3 + V2) TVL in last 90 days
- Compare daily SushiSwap vs UniSwap (V3 + V2) TVL in last 90 days with animation
Glossary
-
what is sushi: according wiki.ng SushiSwap (SUSHI) is an audited Decentralized Exchange (DEX) and DeFi (Decentralized Finance) protocol described as “Uniswap meets Yield Farming” with SUSHI tokenomics. The protocol’s native token SUSHI is used to govern the platform. SUSHI holders also receive a portion of the trading fees on SushiSwap.
-
what is uni: according wikipeida Uniswap is a cryptocurrency exchange which uses a decentralized network protocol. Uniswap is also the name of the company that initially built the Uniswap protocol. The protocol facilitates automated transactions between cryptocurrency tokens on the Ethereum blockchain through the use of smart contracts. As of October 2020, Uniswap was estimated to be the largest decentralized exchange and the fourth-largest cryptocurrency exchange overall by daily trading volume.
-
what is TVL: according coinmarketcap glossary Тotal value locked represents the number of assets that are currently being staked in a specific protocol.