Velodrome Health (Redux)
Solution
as said in previos part velodrome has two main part let’s calculate health with this information :
1. Swaps
- Swaps count
- Swaps volume
- distribution of swaps tx volume
- varient swaps volume
- distribution of user transactions count
- most popular swaps pair based on volume
2. Liquidity
- find liquidity of pools and compare with most popular swaps pair based on volume.
- distribution of volume who provide liquidity for top pools
- varient wallets Liquidity provider volume for top pools
as metrics defined it is time to see “How healthy is this project?”
this part compares swap volume and unique swapper chart ( from pattern that each one make ). maybe we can split this chart into two part. first part is for until 15 Sep and second part start from 16Sep until now.
at first part we can say take time to user know about velodrome and golden age of Optimism network. as data show volume in this age is higher but less user know about velodrome . but second part is age of bear market but user known by community
some points about this charts:
- 7 of 10 Top pools are sAMM pools (for stablecoins).
- some of pool have negative liquidity because for this pool liquidity provided before time that get snapashot from blockchain
- for correlation between liquidity and each point that go right has better liquidity status and when go up increase swap volume. Best place can be for token that are in y=x line and keep the balance between liquidity and swpas
seems according on overview of pools most of pool has enough liquidity and can handle swaps and swaps price ✅
Summery of top 4 pools
reviewing of all poll need lot’s of time and make article boring. so choose top 4 used poool and review this pool to see is these pools are healthy and user can trust this pools or not? these pool review in multiple chart and these chart shows :
- calculate Average , variance and standard deviation volume provided as liquidity : each amount avg is lower and variance and SD near to avg. shows
- Distribution of liquidity providers based volume : if chart in all side has equal value or lower volume has more providers shows normal users provide volume and less possible during market condition remove their liquidity and safer Pools
- in last part i show top provider and withdrawer to show if some and limited amount of address provide all liquaidity show liquidity provide from some organization and VC and if market condition wasn’t good remove all liquidty and make pool dangers
about 11.6M from 16M swaps done through this top 10 wallet and about 1.1B USD of volume done with top ten wallets. This wallet play strong rule in Velodrome.
Problem
- Create at least 5 metrics on Velodrome with a description for each that showcase traction and success in a data-driven manner.
- Most importantly, your insights should help our readers answer the question "How healthy is this project?"
Introduction
growth of crypto project and Technology around blockchain and smart contract open new Door in Blockchain and Crypto. Many projects are born every day and most of them has lot’s of similarity.
These projects sometimes do many things to show that they have more market share. Sometimes by innovating and adding new features, sometimes by promoting their project in different places, and sometimes by giving lots of incentives to users but not all times these behaviors are good. Sometimes, projects may be affected by incorrect methods, such as using robots to increase the number of transactions and wash trading, etc. In order to identify these wrong behaviors, we need parameters to check the health of crypto projects
there are multiple parameter to define how much healthy a Dapp. some of them are general like number of users and some of them depend on Dapp and usage of the Dapps.
so at first we should purpose and usage Velodrome. as what show in first page and in Velodrome App page:
> # Velodrome== is The Trading and Liquidity Marketplace on Optimism.
from this quote we can find two main purpose of Velodrome: 1. Trading (Swaps) 2. Liquidity. In the following content, I devide these metrics in two part.
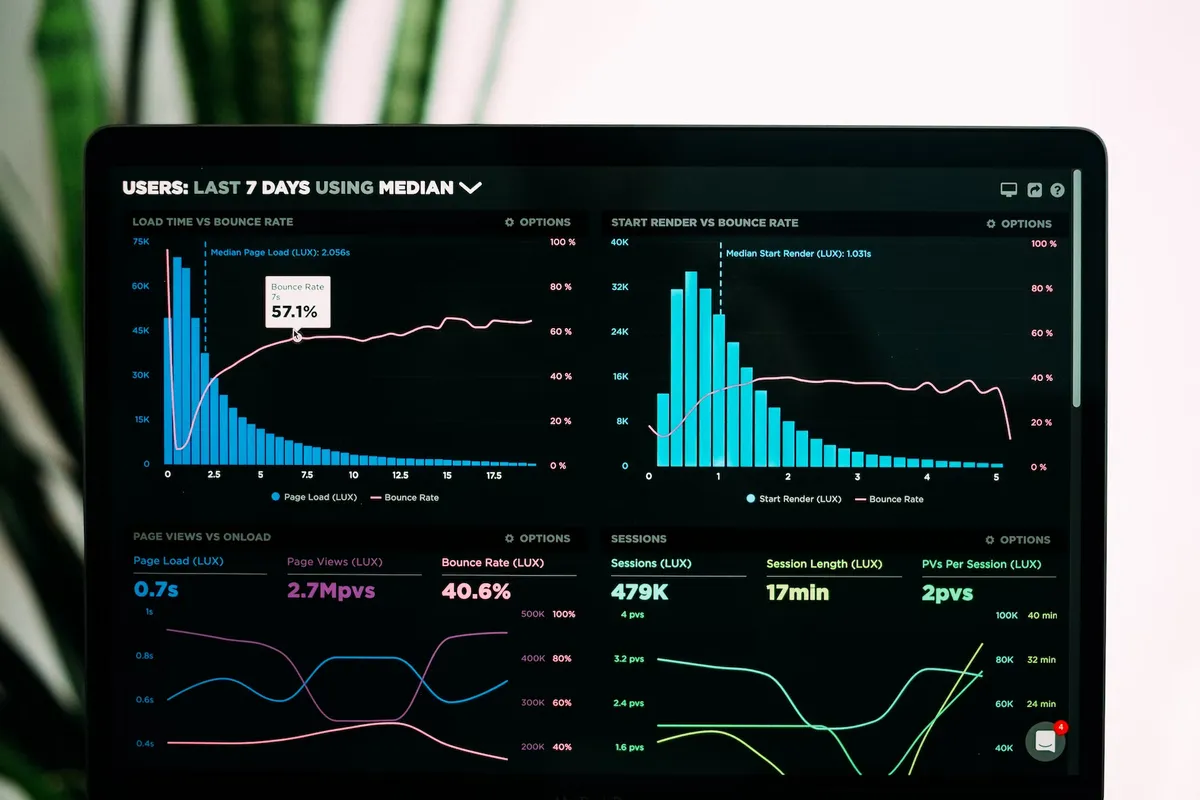
in first step , I calculate and put daily swap volume and swap count side by side to compare how growth these values in last two month. Some bold point we can see in charts:
- in less than 5.5 month from launch Velodrome has more than 2.6B swap volume and 16.7M swap transaction.🎉
- number of swap and volume both have similar look and growth same. this shows volume and swap count have direct relation. so we can see there is less possibility to one or little number of wallet make all Volume.
with this chart seems Velodrome can get first :white_check_mark: for health. of course there is a lot parameter is there to find status of projects. in next step we find out who create this amount of Volume? does it made with diffrent user or just some bot do all of these TX
until now I just show daily information in this section I decide to show some information from whole picture.
- more than 85% of swaps has less than 100 USD value
- 292 swap have more than 100k USD value and only 2 swap with more than 1M value
- less than 3% of swap has more than 1K USD value
- 98.7% of wallets less than 100 swaps
- 9 address ( Contract ) has more than 100K swap and only two of them has more than 1M
- about 30% of address has more than 1K USD swap
- range 100 - 1000 USD is most repeated range in total amount swapped by user
from information that I get, I think chart totally shows the nature of L2. because main reason for using L2 is chip gas fees and light usage and user has more transaction. we usualy don’t have large Transaction in L2 and this transaction done in L1 for more safety. chart shows most of user (70%) has less than 1K swap in last two month and most of swap in range 10-100 dollar.
from prespective this information i think data show bahavior of transaction in velodrome is health :white_check_mark:. ( we don’t see large volume transaction that make fake volume and transaction seems totally normal from L2 bahior.)
Stablecoins play strong rule in defi. (8 of top 10 based on volume and 7 of top 10 based on liquidity) swap pair has stable coin at least in one side. in other side Stablecoins pool has most of valuable LPs .
one of thing that very important for Dapps like Velodrome or Uniswap and etc. is there is enough liquidity for swap specially for top pairs.as show OP-USDC , WETH-USDC , VELO-USDC are most trading pair and also has most vAMM pools. this can be one of metrics for calculating the health of Dapps. because this cause use has confidence and able to transaction coins with best price :white_check_mark:.
Conclusion:
- The L2 has been created to that users can make their own microtransactions with less cost than the L1. Although L2 has high security, it is still less than L1. As a result, we expect transactions with large volumes to be done in L2 less than in L1, and most of the swaps on L2 be small (under $1000). Also, in L2 due to the lower fee, the number of user transactions is more than in L1. According to my analysis, in Velodrome, more than 90% of swaps have a volume of fewer than 1000 dollars and the number of swaps is high. These are one of the reasons for the health of this platform.
- Stablecoins are one of the main foundations of DeFi and account for the largest volume of swaps. In Velodrome, 7 of the top 10 pools are sAMM, which shows that it has enough liquidity for stablecoins.
- One of the signs of the strength and health of trading platforms is that they have high liquidity for the most used swap pairs so that when the volume of swaps in a pool increases, the price does not show wrong. In the velodrome, the three pools that have the highest volume of swaps also have the highest liquidity.
- Another sign of health for liquidity pools is that not all liquidity is provided by a specific team or project. Otherwise, the pool may be manipulated by them or, like 3ac or Celsius, they may remove their liquidity from the pools when they facing a liquidity problem, in which case the platform will suffer serious problems. So the top 4 velodrome pools were examined.
Swaps
one of main feature of velodrome is it is trading and swap feature. in this part there is so much Dapp on Optimism. DEX like Uni and Sushi and aggregators like Paraswap and 1inch are some of this Dapps but as Data shows Velodrome take first place from Transaction and Volume in last month. so, it is time to see how much these metrics are true and users are real.
this chart shows info in first day number of unique user are usually higher than other days. in first day and after airdrop lot’s of user use projects to test power of Dapps. but in next days this number get lower and lower. this low number shows must of user do transaction more than one and propably must of this transaction done by other contracts. but in OCT number of unique user growth. this time ethereum The Merge happend and Ethereum and L2 has higher transaction count. These values do not have an absolute result. Another use of smart contracts is one of the reasons. However, the results could be better than this and it seems that this criterion does not have a clear result
Liquidity
another feature of velodrome and The most important dependency of any Dapp is Liquidity of their poll. Dex without enough liquidity can’t provide correct price ratio and loos trust and users. so best way to review Liquidity is find all pool and review volume and amount swaps. but reviewing all pool is need so much time and not worse for that amount of effort. best way is separate most useful pool and check health of this pool. because most of times people use this pools and these represent all liquidity.
according pools info and chart seems:
- USDC/sUSD most of liquidity provided by whales but normal user also provide good amount liquidity. this pools status are ✅.
- USDC/DAI pool has better condition in range of value provided value. worse average than USDC/sUSD but much better in providers✅.
- WETH/USDC is first pool that both side isn’t stable.most of this liquidity provided by whales but better avg and variance and sd than prevs✅.
- OP/USDC has best pool status and seems most of their values provide by normaller user than other ( less whale) and has best statics among this pools ✅
How healthy is this project?
as data shows seems velodrome in most of factors get green check mark and this shows this project is health✅.but in some factors seems could act better. factors like some pools and daily unique user are metrics that need much more research to ensure is full healthy. ofcorse in case of pool existing some whale or org to provide liquidity is not bad sign as self and should research where this coins came from. fall down like what happend of FTX and Celecius get user woried about Crypto (more from CEX side) and Dex with transparency could revover this trust to user.big.actors like Velodrome with healthy acts is one of these Dex.