2022 Retrospective
Let’s explore some key indicators of the health of the Web3 industry.
📌 Overview
- in this dashboard,I will review the following
- In the first stage, a brief introduction to what is WEB1 & WEB2 & WEB3?
- Total ETH GAS & Transaction on Ethereum
- Total value dex swap & swapper & Number of swaps
- Top DEX with Number os swap & swapper & value swap
- GAS MINT
- Analyze each chart
- General conclusion about the dashboard
🖋️ Methodology
- I Used
ethereum.core.fact_transactionsandethereum.core.ez_dex_swaps ethereum.core.ez_nft_mints- block_timestamp >= '2022-01-01'
- event_name = 'Transfer', Swap, Mint,
Question❓
> > 1. Project ETH supply growth for 2023 by using various average gas prices. > 2. What is the highest value DEX swap, by protocol? > 3. Where was there the most DEX swaps by protocol? > 4. Which were the highest gas consuming NFT mints?
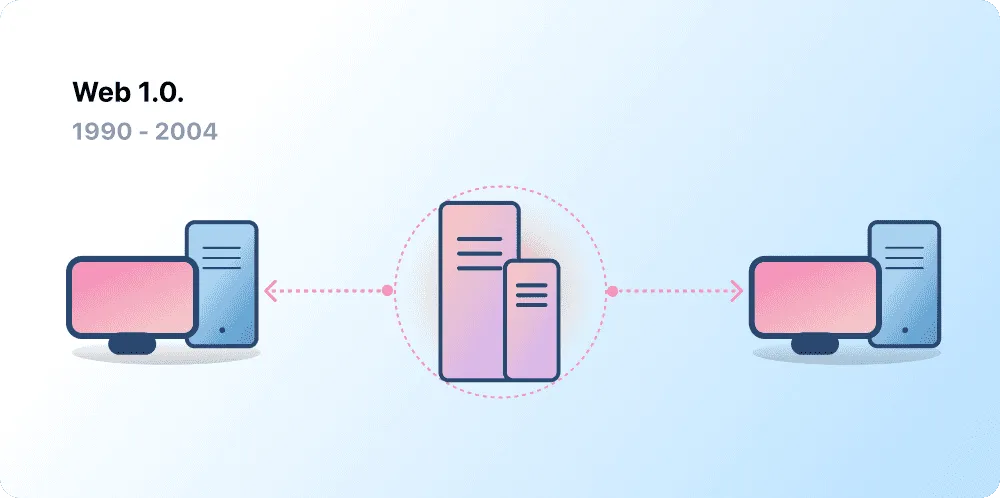
📌Web 1.0: Read-Only (1990-2004)
In 1989, at CERN, Geneva, Tim Berners-Lee was busy developing the protocols that would become the World Wide Web. His idea? To create open, decentralized protocols that allowed information-sharing from anywhere on Earth.
The first inception of Berners-Lee's creation, now known as 'Web 1.0', occurred roughly between 1990 to 2004. Web 1.0 was mainly static websites owned by companies, and there was close to zero interaction between users - individuals seldom produced content - leading to it being known as the read-only web.
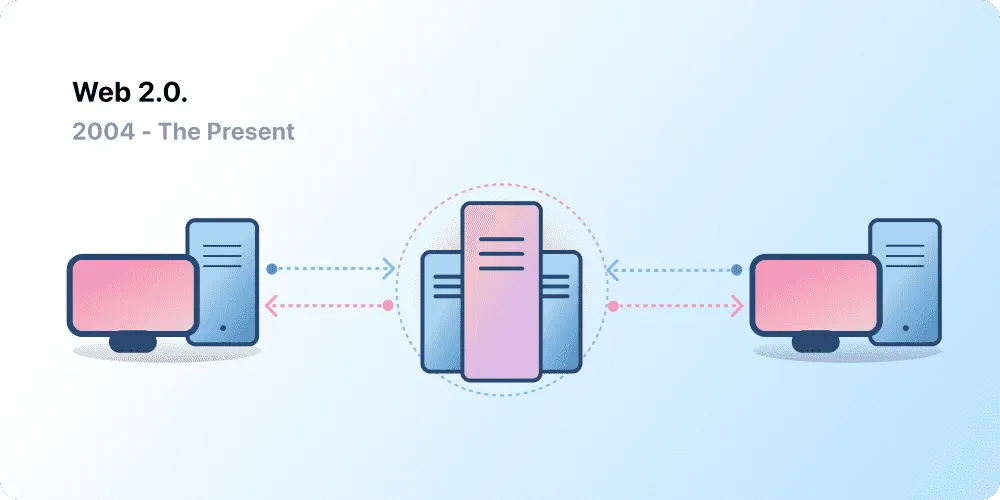
📌Web 2.0: Read-Write (2004-now)
The Web 2.0 period began in 2004 with the emergence of social media platforms. Instead of a read-only, the web evolved to be read-write. Instead of companies providing content to users, they also began to provide platforms to share user-generated content and engage in user-to-user interactions. As more people came online, a handful of top companies began to control a disproportionate amount of the traffic and value generated on the web. Web 2.0 also birthed the advertising-driven revenue model. While users could create content, they didn't own it or benefit from its monetization.
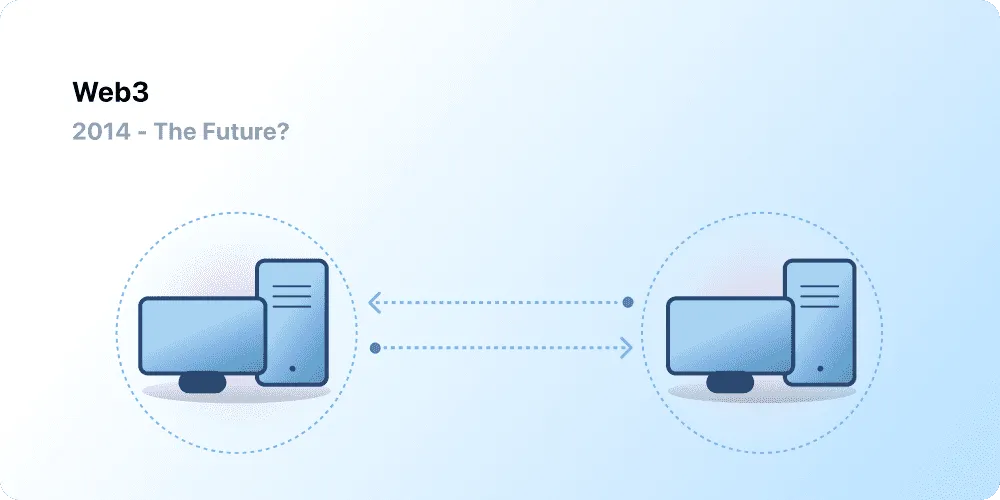
📌Web 3.0: Read-Write-Own
The premise of 'Web 3.0' was coined by Ethereum co-founder Gavin Wood shortly after Ethereum launched in 2014. Gavin put into words a solution for a problem that many early crypto adopters felt: the Web required too much trust. That is, most of the Web that people know and use today relies on trusting a handful of private companies to act in the public's best interests.
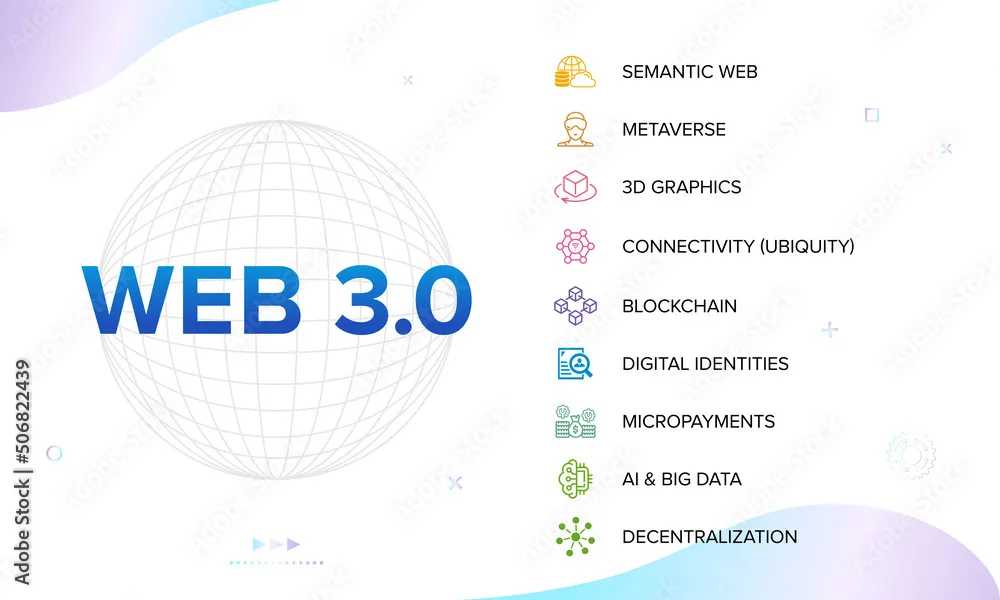
What is Web3❓
> To understand Web3, it makes sense to understand what came before. The first version of the Internet – known as Web 1 – arrived in the late 1990s and comprised a collection of links and homepages. Websites weren’t particularly interactive. You couldn’t do much apart from read things and publish basic content for others to read. > > Brian Brooks, the CEO of Bitfury, put it smartly in a speech to the U.S. Congress in December 2021: “If people remember their original AOL account, it was an ability to look in a curated ‘walled garden’ at a set of content that was not interactive, but was presented to you on AOL, the way that Time Magazine used to show you the articles they wanted you to see inside of their magazine, just you could see it on a screen.” > > Web 2 came next. Some people call this the “read/write” version of the internet, in reference to a computer code that lets you both open and edit files rather than just view them. This version of the Internet allowed people to not only consume content, but create their own and publish it on blogs like Tumblr, Internet forums and marketplaces like Craigslist. Later, the emergence of social media platforms including Facebook, Twitter and Instagram took content sharing to new heights. > > After a while, the general public became cognizant about the way their personal data was being harvested by tech giants and used to create tailored advertisements and marketing campaigns. Facebook, in particular, has had the spotlight shone on it innumerable times for breaching data privacy laws and was hit with a $5 billion fine in 2019 – the largest penalty ever issued by the Federal Trade Commission (FTC.) > > Although Web 2 has brought the world amazing free services, a lot of people have grown tired of the new “walled gardens” these huge tech companies have created and want to have more control over their data and content. This is where Web3 comes in. > > Web3 can be understood as the “read/write/own” phase of the Internet. Rather than just using free tech platforms in exchange for our data, users can participate in the governance and operation of the protocols themselves. This means people can become participants and shareholders, not just customers or products. > > In Web3, these shares are called tokens or cryptocurrencies, and they represent ownership of decentralized networks known as blockchains. If you hold enough of these tokens, you have a say over the network. Holders of governance tokens can spend their assets to vote on the future of, say, a decentralized lending protocol. > > Again, here’s Brooks: “The real message here is that what happens on the decentralized internet is decided by the investors versus what happens on the main internet is decided by Twitter, Facebook, Google and a small number of other companies.”

📚 Conclusion
> As seen, in terms of the number of transactions on the network, there has been a steady trend since the beginning of the year, but in terms of the amount of paid GAS, we have seen a decrease in volume. > > In terms of the volume of swaps, during 2022, we have seen a decrease in the volume of swaps, but in terms of the number of swaps, there has been an increase, and in terms of the number of swappers, there has been a constant trend. > > UniSwap has always been the most popular Dex on the Ethereum network. > > In terms of the consumed GAS for Mint NFT, we have also seen a decrease in the consumed GAS. > > But in terms of the number of mints and users, this trend has been constant. > > > The most important positive thing that happened to the Ethereum network in 2022 was the reduction of the consumed GAS on the network, which before this year I myself did not want to use this network due to the high consumed GAS of the Ethereum network, but now I can easily use this network. I do, > >
My Data :grinning:
discod : esi69#8413
> # thanks for reading !
Appendix
The solution of this question and the queries are completely used from the filipside database
The construction of the dashboard was also used from the site app.flipsidecrypto.com/velocity, which belongs to flipside
Observations
> The graph on the left is related to the number of transactions on the Ethereum network on a daily basis since the beginning of the year. > > As you can see, since the beginning of this year, the trend has been almost the same, that is, it has neither decreased nor increased. The highest number of transactions was 1.93 million transactions on December 9.
> The graph on the left is related to the volume of GAS on the Ethereum network since the beginning of the year on a daily basis, as you can see, this trend has been almost decreasing since the beginning of this year. > > However, the number of transactions has remained constant, but the GAS fee has decreased, which is a positive point for the network. > > The highest GAS on May 1 was $81,000.
DEX SWAP
Observations
> The graph on the left is related to the volume of swaps on the Ethereum network on a daily basis since the beginning of the year. > > As you can see, this trend has been almost decreasing since the beginning of this year. > > The largest volume of swaps on the 4th day of JAN was more than 30 billion dollars. > > The largest volume of swaps has always been in the Uniswap-v3 DEX.
> The graph on the left is related to the number of swaps on the Ethereum network since the beginning of the year on a daily basis, as you can see, this trend has been almost increasing since the beginning of this year. > > The highest number of swaps on October 21 was more than 150,000 swaps. > > UniSwap-v2 has always had the largest number of swaps.
> The graph on the left is related to the number of swappers on the Ethereum network since the beginning of the year on a daily basis, as you can see, this trend has been almost constant since the beginning of this year. > > The highest number of swappers on January 10 was more than 60,000 users. > > UniSwap-v2 has always had the largest number of swappers.
Observations
> The data in the above section is related to the top DEXs in terms of the number of swaps, the number of swappers, and the volume of swaps. > > In terms of the number of swaps and swappers, UniSwap-v2 ranks first. > > But in terms of swap volume, UniSwap-v3 is in first place by a large margin.
Observations
> The graph on the left shows the consumed GAS for Mint NFT on the Ethereum network since the beginning of the new year on a weekly basis. > > As you can see, with the passage of time, we have seen a decrease in the consumed GAS, the highest consumed GAS are related to the third week of February in the amount of 347 thousand dollars.
> The graph on the left shows the growth of the consumed GAS for MintNFT on the Ethereum network since the beginning of the new year on a weekly basis. As you can see, with the passage of time, we see an increase in the growth of the consumed GAS.
> The chart on the left shows the number of NFT mints on the Ethereum network since the beginning of the new year on a weekly basis. > > As you can see, with the passage of time, this number has been almost constant. The highest number of mints was 1 million in the second week of September.
> The chart on the left shows the number of NFT minters on the Ethereum network since the beginning of the new year on a weekly basis. As you can see, with the passage of time, this number has been almost constant. > > The highest number of Minter users was 367 thousand in the second week of September.
> The graph on the left shows the average and maximum volume of Mint NFT consumed GAS on the Ethereum network since the beginning of the new year on a weekly basis. > > As can be seen, both the average consumed GAS and the maximum consumed GAS have decreased over time
Observations
> The data on the left is for the top NFT collection on the Ethereum network based on the highest consumed GAS in 2022, which is as follows > > > 1. tubby cats = $263K GAS > 2. the otherside = $127K GAS > 3. ens = $34.4K GAS