Bloody May!
In This Bounty we aim to investigate swap volume and number of transactions in Algorand DEXs as it seems there is a significant increase in both criteria. Thank you in advance for staying with this analysis until the end.
Introduction & Methodology
Certainly, one of the signs of maturity in a market is that it reacts on the various events and happenings inside and outside of its native ecosystem. Any good or bad news can be reflected on market behavior and vice versa, meaning the reason behind any significant market behavior can be sought after in different forces and sources.
For today and our purpose, it seems that there is a significant increase in swap statistics in Algorand DEXs as flipside claims. We are going to validate this claim, break it down and try to find out what can possibly be the reason.
I would like to mention some methodological choices I had to make to make the query simple, understandable and reliable. First, i should mention that due to abundant of ASA it is nearly impossible to just measure Swap Count and volume for all Algorand tokens; So I made the decision to narrow down our under investigation assets to top 10 ASA that had most number of transactions since the beginning of March. This will construct a list of familiar tokens that we already know are very popular. One point that also should be noted is that most comparative charts are set in logarithmic scale to better demonstrate the differences and analogies.
Data & Analysis
We will begin the work with validating the claim; Is there an increase in swap Stats in may 11 and 12? Is it significant? That Middle Finger raised to our face says YES! Almost all top 10 ASA that we chose experienced 2x to 4x increase on the mentioned date. So we are safe to move forward...
To Break this down I focused on those exact days to see what are top ASAs that users are swapping in and out? how many transaction is occurring for each ASA? This will help us to see if any specific token is responsible for increase in swap stats (sometimes special events for a project can do that).
Some Notes:
- STBL and USDC are among top3 in terms of transactions count but in lower rank in swap volume; Because ASAs like YLDY and Defly has high supply and cheap price comparing to 1$ stable price of USDC and STBL.
- There is nothing significant about transaction count and volume of any specific token.
To further investigate the situation I tool ALGO as a reference to see how it's being swapped? are people trading their ALGOs for stable coins or other tokens? You can see that USDC and STBL (Both stable coins) are the most popular assets to swap out of ALGO. Reminding ourselves that these stats were increasing, what can possibly be the reason? Normally we can see increase in dominance of stable coins in correction movement so we can expect that price of ALGO and the whole market experienced a sharp decrease... And this is indeed True as shown in ALGO price chart...
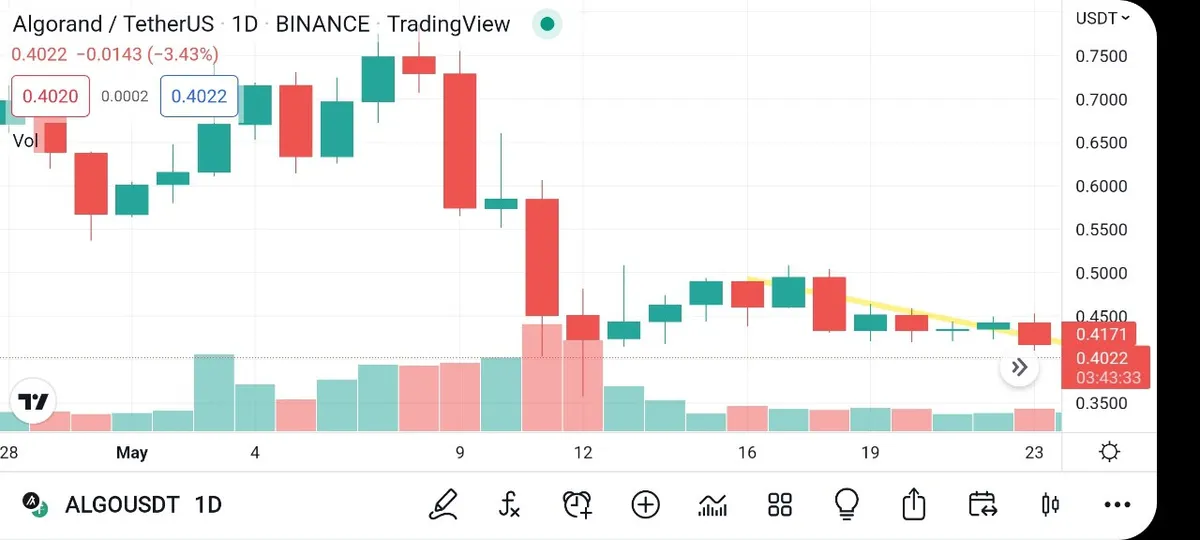
Bloody May started with TerraMoney crash which had negative impact on market in various ways. the sense of fear dominating the market was in a level that every little down movement was interpreted as a sign of even bigger crash and this FUD further permeated into Algorand ecosystem with it's algorithmic stable coin.
One final thing that I'm willing to show is that average ASA per Swap doesn't change dramatically, But only 10 to 20 percent on some cases