DIY Algorand New User Bounty
In this dashboard, I am going to show you how to approach solving an Algorand Bounty Step By Step From the beginning. After following this guide you should be able to understand: - When should you use labels & payment_transactions tables from Algorand database - How to create charts using Velocity - How to plan and create an appropriate query to achieve what you are looking for so.... LFG!
For the purpose of this guide, flipside provided us a question which i already answered days ago. I am going to show you how i practically solved that bounty. The question is as follows:
Let's look at the popularity of centralized exchanges(CEX) when it comes to Algorand:
- Chart the volume of ALGOs moved to each CEX by day since the beginning of 2021.
- Chart the volume of ALGOs moved from each CEX by day over time since the beginning of 2021.
First, we got to ask ourselves, there should be Algorand Addresses respectively belong to Centralized Exchanges. How can we find them? In most velocity databases there is a table consisting of Labels. this means that it is already knows that X is the Address for this CEX or DEX and this is recorded in a specific table. In Algorand database this table is: Labels. if you click on "preview" you can see what you can expect from that table. Somewhere in between you can clearly see a lot of "cex" which means these are addresses that we are looking for and in this stage we should find a way to filter them out. So this is what we are looking for to get started: List of Algorand Addresses that belong to CEXs.
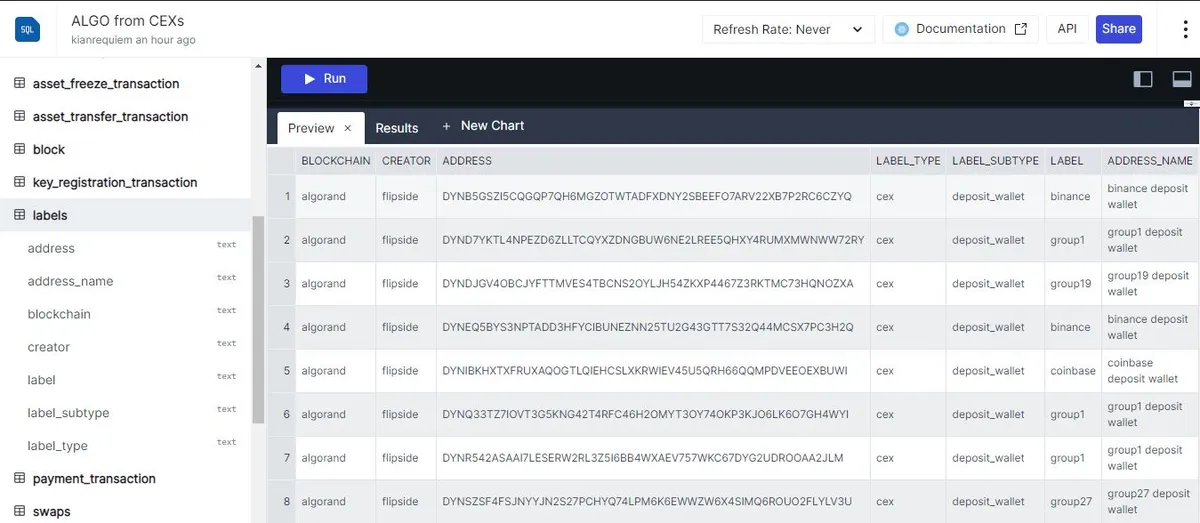
So...dear velocity app, give us address and labels of all the addresses in Algorand database that belongs to CEXs and name this collection as cex_address so we can look into it later:
WITH cex_address AS (
SELECT address, label
FROM algorand.labels
WHERE label_type = 'cex'
),
Now more tricky parts are coming. the question is how do we know which table should we use to get the result we want? well, you should check on flipside documentation to read about every set of data recorded and provided in each table. names are pretty much explanatory. in our case, we want to take a look to see if payment_transactions table is a fit for our purpose:
let's say we made sure that this is it (you can always ask in discord too), now what? what are we going to do with this table? what does it actually tells us?
this table consists of all transactions which transfer Algo from one address to other; exactly what we want, right? so let's tell velocity to give us Amount(of Algo), Label (Cex name), sender (Cex Address as we want to query Algoes from Cexs) and Date:
SELECT DATE(block_timestamp) as DATE,
sender as cex_address,
label as cex_label,
amount as sent_amount
FROM algorand.payment_transaction
Wait a minute! we don't have Label in payment_transactions table, what should we do? well, in this case we can join 2 tables to be able to select from both. how? we use the INNER JOIN order to make this happen. this is how it should work:
sent_From_cex AS (
SELECT DATE(block_timestamp) as DATE,
sender as cex_address,
label as cex_label,
amount as sent_amount
FROM algorand.payment_transaction
INNER JOIN cex_address ON sender = address )
We read this like this:
give us Amount, Date, Address and Name of Cexs which send algo to other wallets, take information you need from table of payment_transaction on Algorand database, and in case Sender was same as Address you can use cex_address as a source of data too; and in the end name this collection as sent_from_cex
We are getting pretty close to our goal. what's next? we have every Source of data we wanted and now we just need to demonstrate results properly. we want to show how much (sum of amount) Algo is transfering out of these CEXs in a Daily Basis, so we go like this:
SELECT cex_label,
sum(sent_amount) AS total_amount
FROM sent_from_cex
WHERE DATE >= '2021-01-01'
GROUP BY cex_label
ORDER BY cex_label ASC
We used our previous set of data which we created as a source to pull out data from it. Group By order will unify and add up the Amounts for each Cex and ASC depicts them from lowest to highest.
Now is the time to make this more understandable and appealing to audience; so let's go to Chart making by clicking on "new chart".
This is the landing Screen and as you can try yourself there are many options which determine the type of your chart, which you should choose carefully according the data that your are going to demonstrate.
for our purpose, it's better to use Bar Chart as we chose our Variables in manner that suits this perfectly. With Cex_Label as X axis and Total_Amount as Y axis we are able to see which CEX has the most Amount of Algo sent From comparing to others.
Now let's say we want to see how does it look like when it comes to daily amount sent from a single CEX? that shouldn't be that hard, right? we Already have all the data we need, all we need to do is to demonstrate only 'binance' and group the results by date. so this is how it should look:
SELECT date_trunc('day', DATE) AS time_period,
cex_label,
sum(sent_amount) AS total_amount
FROM sent_from_cex
WHERE DATE >= '2021-01-01'
AND cex_label in ('binance')
GROUP BY time_period, cex_label
ORDER BY time_period ASC
and the chart looks like this:
To be able to see how much Algo was sent TO CEXs all we have to do is to replace sender with receiver, meaning that this time CEXs are the receivers of Algos.
In the End, I want to talk about some terms and argue why and how these information can be of use in cryptocurrency space. what were we investigating here? first, Volume. In trading there's nothing more important than Volume. there are methods of trading known as Volume trading that Focus on Volume as the most important factor to start a position. Volume shows that how much of a certain asset (amount) is being traded across CEXs and DEXs which ultimately shows how attractive the price is foe whales and retail traders. having access to Volume Uptrends and Downtrends can help you decide whether it's a good time to buy or sell an asset or to know if a green candle will be start of a good run or not.
on the other hand, and as the second factor, we should know that how much of a certain asset is being transfered in and out to/from CEXs/DEXs as a means for potential strong increase or decreasing in price.
so as you see, having the access and ability to evaluate on-chain data has many benefits which are taking your first steps to master this criteria. Good Luck then!