Liquidity Pools - Wallet Composition
Introduction
-
In this analysis, You will read about Liquidity providers on Osmosis. We want to know which types of users add and removing Liquidity On Osmosis.
I divided Osmo Holders into four types of users that are popular in the crypto world. Whales, Sharks, Dolphins, and Fishes.
-
I went through Osmosis Liquidities and analyzed these parameters:
-
Transactions add/Remove
-
Users Add/Remove
-
Volume in USD Add/Remove
-
Users Breakdown
Analyzed by Hess - Reading Time Almost 8 Min.
Method
User types Definition:
-
Whales: Holds +100000 Osmo
-
Sharks: Holds between 10K and 100K Osmo
-
Dolphins: Holds Between 1K and 10K Osmo
-
Fishes: Holds Below 1K Osmo
-
I extracted user addresses with their balances from Osmo osmosis.core.fact_daily_balances. Then, Joined with Liquidity action tables. I needed volume in USD. So I joined again my findings into DIM price tables and calculated the volume in USD.
Remove Liquidity
- Like adding Liquidity, Fishes were the highest number of users that removed their liquidities. About 42% of removed liquidity users were fish. The second place is dolphins. 21% of users were dolphins, 19% were Whales and 16% were Sharks. Over time, whales’ and shark’s weekly shares didn’t change but the Weekly share of Fish increased and the weekly share of dolphins decreased.
Conclusion
- Fishes had the highest number of users in adding and removing liquidities. Whales had the highest volume and transactions in adding and removing liquidities. Over time, The share of these users didn’t change too much. However, There were some points the share of some types of users increased or decreased but it wasn’t too much. Almost the swing was 10%.

A Summary of the most important Findings
**Add Liquidity:**
-
Based on Add liquidity providers, The highest number of providers was Fish. 10% of users were whales.
-
Based on Add Liquidity transactions, The highest number of transactions belongs to Whales.
-
Based on Add Liquidity volume, Whales had the highest add liquidity volume.
-
Fishes had the highest average volume of added liquidity.
Remove Liquidity:
-
All Parameters were like Add liquidity. The only difference was the average remove liquidity volume which Shark had the highest volume.

Full Analysis
Add Liquidity
-
About 116K Fishes added liquidity on Osmosis. Fishes are 65% of total add liquidity providers. The second large group of providers was Dolphins with 14% of shares. Whales are in third place with 10% of shares. The last group of providers was Sharks with 9.4% of the share.
-
Over time, The weekly share of Whales increased from 20% up to 32% while the fishes share decreased from 40% to 28%. Sharks and Dolphin’s weekly shares didn’t change too much.
-
The total number of add liquidity transactions of all types of providers decreased since March 2022. The highest number of add liquidity transactions belongs to whales. These types of users added liquidity nearly 1M times. Sharks, Dolphins and fishes had similar transactions. Over time, The total number of providers based on their types didn’t change too much.
.
- It is clear that whales added more volume to Liquidities in comparison to others. But what is interesting is that Fishes are in second place based on added liquidity volumes. The other interesting finding is that Dolphins with 138M US dollars are in last place. Over time, The Fish add liquidity of volume increased significantly.
- Fishes with 3.7K US dollars had the highest average volume in comparison to other types of users. After that, Whales with 2K US dollars had the second highest volume. Until October 10, Fish had the lowest average and volume but on that week, The average volume of fish increased up to 505K US dollars. This amount caused a higher average volume in comparison to others.
- Whales removed nearly 1B US dollars from liquidities. The second group of users was sharks which removed 721M US dollars. Fishes and dolphins Removed 83M and 65M US dollars. Over time, The removed volume decreased for all types of users. In some weeks, Fish removed more than the average but overall all decreased.
The highest average volume of removed liquidity belongs to a shark with 5.8K US dollars. Fish had the lowest average volume in comparison to others. Over time, Whales had more average volume but on August 30, The average volume of sharks increased to 314K US dollars and this volume changed the average of sharks.
ALL CODES AND CONTENTS WERE WRITTEN BY HESS.
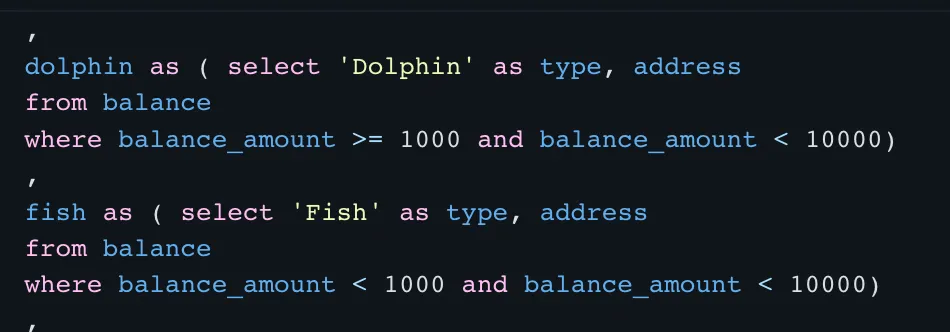
QUERRY UPDATE
- I had a mistake in calculating the Fish and Dolphins. I had to update my queries and delete the second part of fish. So All My charts are updated.