NEAR Foundation Transparency Report: Q3, 2022
Introduction
- In this Analysis, You will read about Near Q3 Official Reports. We want to make the NEAR ecosystem even more transparent. How can you improve on the existing Transparency Report?
Official Report:
https://near.org/blog/near-foundation-transparency-report-q3-2022
There were some key metrics on Near Report.
- Token Distribution
- Staking and Validators
- Active Wallets
Based on On-chain Data, I went through those metrics and made the report more Transparent.
Analyzed by Hess - Reading Time Almost 12 Min.
Users Journey on Near
According to The Near Foundation Report, Weekly Active Wallets surged to 280k per week — up from 26k at the end of Q2. To make it transparent, I examined active wallet activities since Q3 2022.
We don’t know exactly the criteria for active wallets on the reported report, but I tracked all wallets that had more than 25 transactions since July 2022.
-
First, Let’s look at Near users. Then, I’ll examine active wallets.
-
The highest daily share of active wallet transactions is transferring. The daily share of transfer transactions is around 50-60%.
-
The interesting part is Liquidity transactions are in second place. About 25-35% of total active wallet transactions was adding liquidity.
-
Stake, NFTs, and Swap had the lowest number of transactions based on Active wallet activities.
\
Near Distribution
Until Now, I analyzed two key metrics for Near Health. Staking and Active wallets. Another factor for the Health of a chain is the distribution of tokens.
- As you may know, We don’t have an exact balance table for the Near chain. So, I extracted holders from their transfer activities. ( Total In and Total Out ). Following that, Near has 350K unique holders, and the average amount of Near per wallet is 624 Near. The highest amount of Near held by one wallet is 66.7M Near.
Swap Activities
-
The total number of swappers had too many ups and downs. Since November, The total daily number of swappers decreased. Overall, Since Q3 2022, Near had 20K swappers, and the average number of swaps per swapper is 7.2.
The Important metric is swapping Near to Stablecoins or other coins. For this analysis, I examined the swap activities from Near to Stablecoins. Less Swap is a good parameter for the Near chain and its native token.

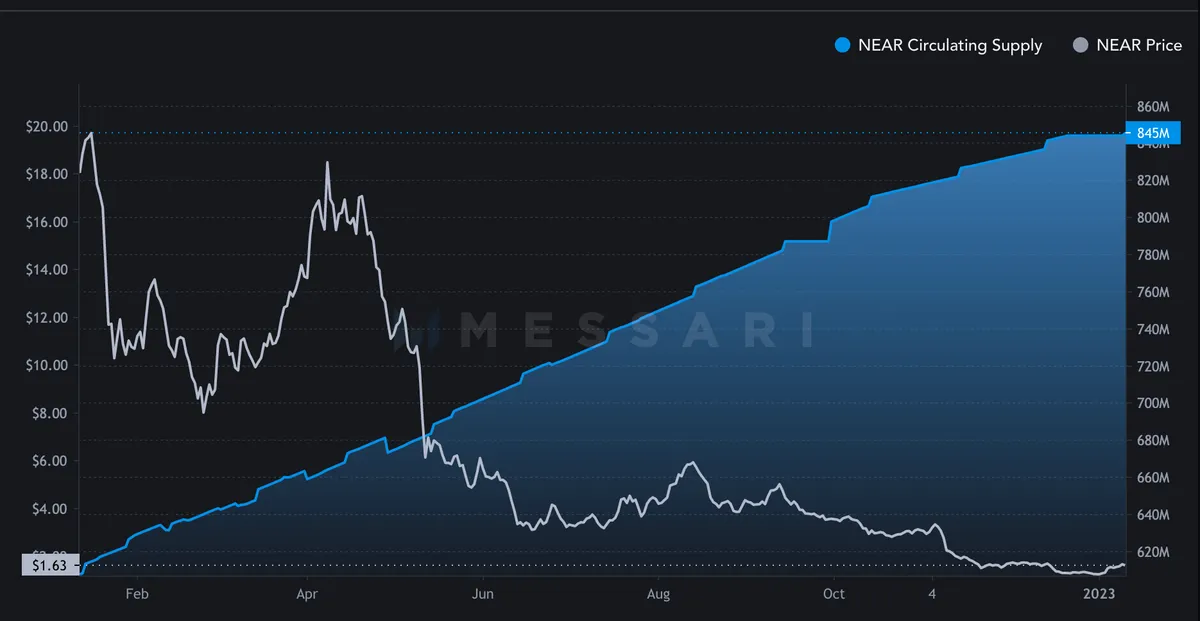
Image **Source: **
Method
- Metric I: Stake and Validators
- I used near.core.dim_staking_actions and extracted all Saking and Unstaking activities from that table.
- Metric I: Active Wallets
- Each wallet with more than 25 transactions since Q3 2022 is an Active Wallet. ( My Definition )
- Metric III: Token Distribution
- We don’t have the exact table for User’s Balance on Near. So, I used transfer tables and calculated User’s Balance approximately to see how Near tokens were distributed to holders.
- Metric IV: Swaps Activities
- Fortunately, We have swap tables for Swap activities on Near. I examined traders and their activities on the Near chain.
Full Analysis
Conclusion
- Since Q3, Near users staked 150M Near into 145 unique validators.
- About 20% of total staked Near, Staked into Figment Validator. Users staked 30M Near into Figment.
- Over Time, The total daily number of stakes increased, but Unstake decreased or had fewer changes.
- In the last six months, The average number of holding stake positions is 41 days.
- Near Has 118K unique active wallets. These wallets made 74M Transactions since Q3 2022.
- The highest activity for Active wallets is adding Liquidity and Transfer.
- Near has 350K unique holders. About 87% of total holders hold below 10 Near in their wallet. 25 wallets have over 1M Near in their wallets.
- The group of holders with 1K-10K Near in their wallets had the highest number of transactions.
- Near has 20K unique swappers, and the average number of swaps per swapper is seven transactions.
- The total number of swaps and swap volume From Near to Stable coins decreased over time since Q3 2022.
ALL CODES AND CONTENTS WERE WRITTEN BY HESS.
Users and Transactions
According to the Near Foundation report, 465m NEAR had been staked (42% of the total supply), representing 62% of all NEAR owned by the ecosystem.126 validators supported the network, with 33% of the total staked NEAR delegated to the nine largest validators.
Staking is one of the key parameters for each chain. To clarify, I examined staking and unstaking activities from Q3 2022 until January 2023.
- Until November 2022, The total daily number of stakers and unstakers didn’t change much. The total daily number of stakers increased from 260 to 350 until November, then increased significantly from 350 stakers per day to 750 stakers. Almost became 2x higher. Between November 8 and November 23, During the FTX crash, The highest number of stakes happened in the Near chain.
- As you can see, The total number of unstakers increased for a short time but overall decreased over time.
- Almost All chains faced a considerable drop when the FTX exchange collapsed, but On Near, the situation was different. This show the health of Near.
- Since July 2022, Near has had 25.5K unique stakers and 12.5K unique unstakers.
According to the total number of unique stakers and unstakers and also the daily number of stakers and unstakers, I can guess that each user staked multiple times on the Near chain.
- The daily share of stake and unstake transactions show the share of Stake transactions increased over time. The Daily share of stake transactions was 55-65% during July but recently reached up to 80% in January 2023.
- On the other side, The daily share of unstake transactions was 33-44% in July but, over time, decreased to 18-25%.
- In the last six months, 75% of transactions were Staking, and 25% were unstaking.
Stake & Unstake Amounts
The total number of transactions and Users are essential, but more important is the amount of stake and unstake. This metric is more important when we talk about the chain's health.
Why? Because it shows the power of validators and the distribution of staked amount. Maybe one User stake a huge amount of Near into one Validator. This action permits considerable power to that validator which can manipulate the chain.
- Since Q3 2022, Users staked 152M Near and Unstaked 75M Near. There were two significant points that a huge amount of Near staked. One was On August 31, when users staked 27M Near, and one was on November 11, when users staked 20M Near. 47M staked Near in two days is 5% of the total circulating Supply of near.
Unlike other metrics that increased over time, The average amount of stake decreased in December and January compared to July 2022.
- The average staked amount is 2K near. The highest average staked amount was between July and September 2022. The highest amount of staked was 20M Near. According to the daily chart, It seems this amount was staked on November 11 by one user.
Validators
- Since Q3 2022, About 30M Near staked on Figment.pool validator. Among the top 10 validators, 50% of the total staked Near, Staked on that validator. In my opinion, this is not good. Because it increases the power of voting that validator. If we compare this amount with the total stake ( 150M since July ), It is 20% of the total staked amount.
- With a huge difference, Astro validator is in second place with 6.6M staked Near. Among the top then validators, Astro has 10% of total shares.
Holding Time
- One of the metrics that shows the health of the Chain is the average number of days users hold their position. Since Q3 2022, the average number of days increased over time. In the last six months, The average days of holding stake are around 41.8 days which is good.
Stakers and Unstakers Breakdown
- The large group of users staked and unstaked only one time on Near. Close to other chains. Also, This group of users staked 10-100 Near.
- The second large group of users staked and unstaked 1-5 times, and the amount of stake was between 100-1K Near, and the amount of unstake was below 10 Near.
- The third group of users staked and unstaked 5-10 times. The amount of staked was below 10 Near, and the amount of unstaked was 100-1K Near.
- Without any extra explanation, the chart below shows the Near platform's health. The weekly net of stake ( Total Staked and Unstaked ) shows almost all weeks, The amount of stake was higher than the amount of unstake.
- Only two weeks, the amount of unstake was unusual. Due to the FTX crash, the unstaked amount is expected to increase significantly. But overall is healthy.
The Cumulative chart shows how the total staked near increased in Figment validator since October 2022. Before October 2022, The distribution of staked of amount was equal but after that time increased significantly.
- The positive thing about Near is that the total number of unique validator increased over time. For example, Users staked into 119 unique validators on December 5.
The large group of Near users ( 28%) had only one transactions. The second large group of users (23.8%) had 2 transactions since Q3 2022. After these two group of users, The third large group of users had 10-25 transactions since July 2022. This group of users had 9.24% of total transactions.
Active Wallets
So far, I examined the Near users. Now, It’s time to examine active wallets on Near. As I mentioned before, Those wallets that had more than 25 transactions since July 2022 are active wallets.
- Based on the above criteria, Near has 118K Active wallets since Q3 2022. These active wallets had 74M transactions in the last six months.
- The number of active wallets increased since September 2022. Before that, The total daily number of active wallets was below 6K but then increased significantly and reached 30K.
- Between September and October 2022, active wallets had the highest number of activities. After October 2022, The total daily number of active wallets decreased over time and reached 10-100K in January 2023.
- The average number of transactions by Active wallets on Near is around 600 transactions. But this is not the right number. Why? Due to the high activity on August 20 and 21, The total number of transactions increased in one day and dropped quickly.
- The right answer is that the average number of transactions by active wallets was 60-65 tx in July and decreased to 20-25 transactions per day.
- Near blockchain had the highest number of new users in September and had the highest number of active users in October. In September, Nearly 1M new wallet joined Near chian. In October, Near had 755K active wallets. More than new users!
- July and August, Near had the lowest number of active and new users. The first 10 days of January 2023, Near had more new and active wallets compared to 30 days of July and August.
Users Retention
The Below chart is based on all users on the Near chain, not only active wallets.
- The highest number of users ( 92.8%) had their second transactions on the same day as their first transactions. The second large group of users returned less than a week for the second transaction. The third large group of users came back after a month.
- 87.5% of Near holders hold below 10 Near in their wallets. It means 306K unique users have below 10 Near. The second large group of users ( 8%) hold between 10 and 100 Near. The total number of wallets that held more than 1M Near in their wallets is 25 unique wallets. Each of them have more than 1M Near.
I tracked the holder’s transactions to see which group of users was more active.
- Until August 2022, The group of holders with 1K and 10K Near had only 1-2% of total transactions shares, but after that time, The daily share of transactions increased to 20-35%. On the other side, The daily share of transactions for a group of holders with 100-1K Near decreased from 40% to 20%.
- The group of 1K and 10K Near had the highest number of transactions compared to other groups. The second large number of transactions made by holders with 100-1K Near in their wallets.
- If we ignore the Week that FTX crashed, The total number of swaps from Near to Stablecoins decreased from July until January 2023. The total number of swaps from Near to Stables was nearly 10K but decreased to 3-4K transactions.
- The Most popular pair from Near are USDT and USDC.
Like Transactions, The total daily swap volume ( In USD ) decreased over time. Between July and August, The total daily swap volume from Near to Stable coins was over 10M Dollars but recently decreased to below 2M US dollars per day.