Quixotic NFT Dashboard
Introduction
In this Analysis, You will read about Quixotic the Largest secondary marketplace for NFT on the Optimism chain.
We want to know these parameters:
- Unique Buyers
- Unique Sellers
- Sales Activity
- Volume
- Top Collection
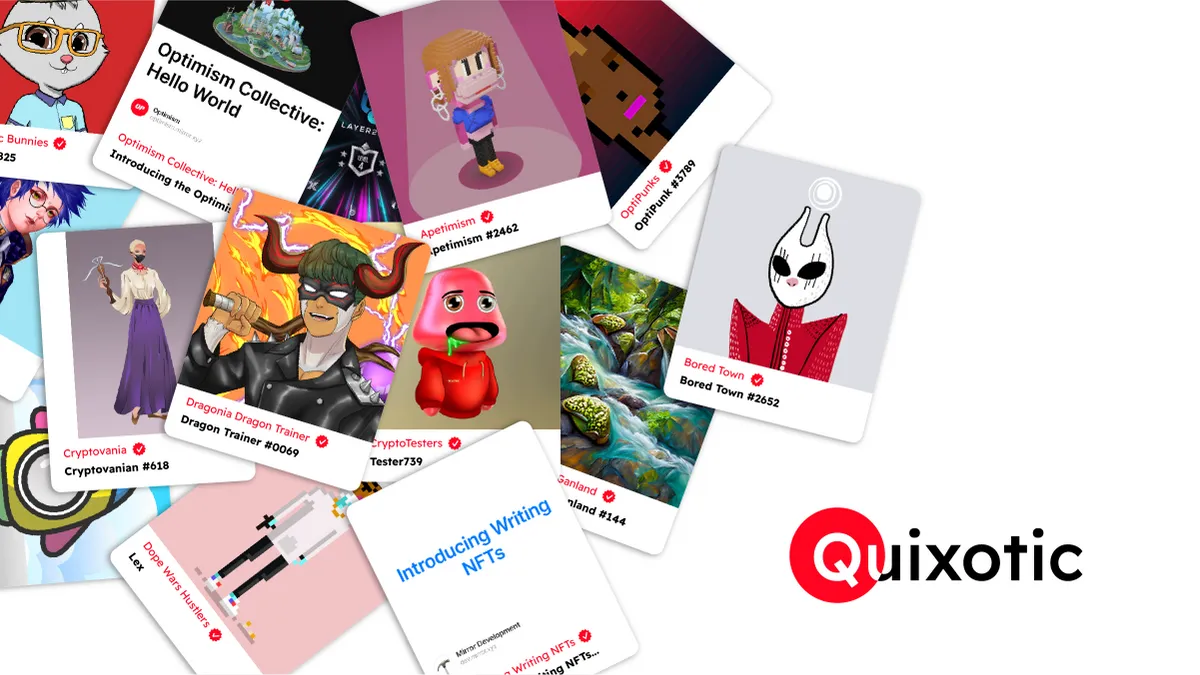
What is Quixotic?
quixotic.io. Quixotic, the largest NFT marketplace on Optimism. Discover, collect, and sell digital items on the largest NFT marketplace on Optimism.
Analyzed by Hess - reading time Almost 8 Min. \n
Method
- We have an NFT sales table on Optimism tables. I used that table and filter Quixotic as a platform. I found the price is based on OP and ETH tokens. So I joined my finding to the hourly price table on Optimism and Ethereum to extract the daily price of OP and ETH. Then Calculated all mentioned Parameters.
Conclusion
We are at Crypto and NFT winter. All marketplace on all chains faced a huge decrease But I think Quixotic on Optimism is growing normally. Not too fast but it’s ok.
The Sales amount and number of sales are far from their mainnet network Ethereum. Some collections exist on other chains. They need more whales to push the NFT market on Optimism. Unfortunately, We don’t have a balance table for Optimism and I couldn’t find any whales.
\
- Since June 2022, 19.6K NFTs have been sold. There were 7.1K unique buyers and 5.7K unique sellers.
Daily Sellers and Buyers
-
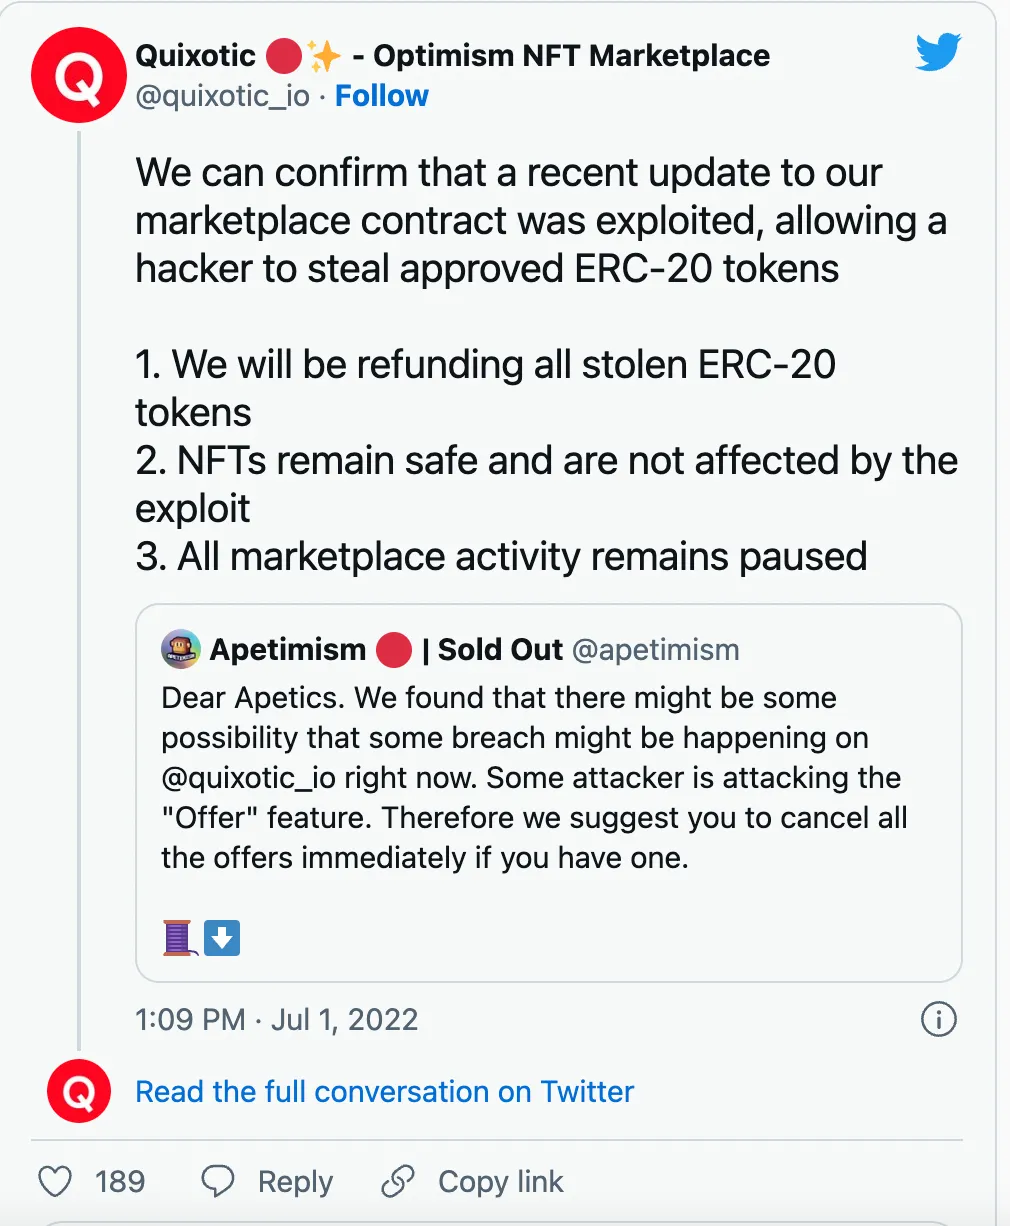
There were some days the number of buyers was higher than sellers and some days sellers were higher than buyers. The highest number of sellers recorded recently was on July 27th with 1397 sellers. The highest number of buyers was recorded on July 1st with 881 Buyers. It is interesting because on that day Quixotic was hacked and Users loses nearly 100K US dollars. Maybe those who lost NFTs buy back some NFTs.
\
-
In the past few days, activities increased on Quixotic. The cumulative chart shows a huge jump in Buyers, Sellers and sales activities.
\
-
In those days, All parameters increased above 100 percent.
- When I see the number of buyers, sellers, and sales in one chart, On some days, The total sales were higher than the total buyers and sellers. It shows that each user made multiple transactions. This is a good metric for the marketplace because, besides swaps or other activities, NFT is not a daily activity for users.
Days of Week
There is a long conversation between crypto guys that days of the week could impact the market. In my opinion, it’s true. For example, The highest number of buyers was recorded on Fridays But the highest number of sellers occurred on Wednesdays. Thursday was similar. There were 1622 Sellers and 1606 buyers on that day. Total Sales activities decreased on Tuesday.
- Since June 15th, 19.6K NFT have been sold from 128 Collections on Quixotic. The highest number of sales happened on July 27th that nearly 2K NFTs sold from 42 collections.
I mentioned before that users can buy NFTs by OP and ETH token on Optimism Chain. Most sales happened in ETH but you can see some OP sales at the end of June.
- The total sales is 424K us dollars and average sales in 18$ US dollars. I couldn’t find why OP sales stopped after July 1st.
Daily Sales amount
I converted The sales amount from OP and ETH to US dollars to understand better. As I showed before, the highest sales happened on July 27th but the volume does not show any specific change during that time. The highest sales happened on July 1st with 143K US dollars. The average sales amount on that day was 158$. The average sales were below 20$. Also, The daily sales volume is below 10K us dollars. All markets on All chains faced a decrease. We are at NFT winter. The sales volume reached from 1K us dollars to 423K in the cumulative chart. As you can see on the Cumulative chart, The Cumulative sales do not follow the cumulative sales amount. The pattern was different.


THE TOP NFT COLLECTIONS ARE BASED ON FLIPSIDE TABLES. SOME CONTRACTS WERE NOT AVAILABLE ON DIM LABEL TABLE.
Top Collections based on Total Volume
- Optipunk with 100K US dollars had the highest sales amount since June 15th. The second collection is Apetimism with 70K us dollars. These two collections have a huge difference from other collections. I can say these are the most popular NFT collections on Oquixotic. In the top 7 Collections, Optipunk has 47% of sales and Apetimism has 34% of sales amount.
ALL CODES AND CONTENTS PROVIDED BY HESS
Twitter_id: hessaminanloo
Discord_id: hess#0890