ENSO index and its impact on global climate
Introduction
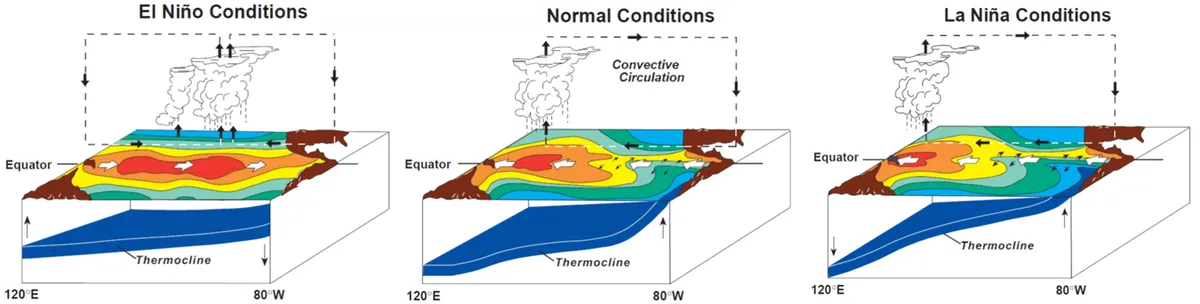
ENSO is an atmospheric-oceanic phenomenon, the formation of its different phases requires the fluctuation of water temperature at the surface and depths of the tropical Pacific Ocean, which is correlated with the evolution of large-scale atmospheric currents. The warm phase of this phenomenon is associated with an increase in the surface temperature of the equatorial Pacific Ocean, which is known as El Niño, and its cold phase is called La Niña, and its performance is the opposite of the El Niño phenomenon. ENSO has three modes: El Niño, Neutral and La Niña, and by affecting large-scale atmospheric waves, it changes the rainfall patterns in many regions of the globe, especially tropical and subtropical regions, and for this reason, it is known as a long-term phenomenon. The return period of the ENSO cycle is between 3 and 7 years, and each phase of El Niño and La Niña can have weak, moderate and strong states, which causes changes in the intensity of their effects on precipitation and air temperature.
In this dashboard, we are going to investigate El Niño and La Niña and their impact on the global climate (specially in North America, Australia, and the Middle East), and we will also evaluate the current state of the Enso index.
El Niño (Warm Phase)
El Niño means Little Boy, or Christ Child in Spanish.
When the Walker cycle weakens or reverses and the Hadley cycle strengthens, El Niño occurs, causing the ocean surface to be warmer than average and cold water upwelling off the northwest coast of South America to be reduced or absent. El Niño is an area of warmer-than-average ocean water that periodically forms off the coast of South America in the Pacific Ocean. This phase, on the other hand, refers to the changes in the surface temperature of the eastern equatorial Pacific Ocean and the atmospheric pressure of the air in the tropical western Pacific Ocean. El Nino is associated with high pressure in the western Pacific Ocean. The mechanisms that cause this fluctuation are still under study.
El Niño means Little Boy, or Christ Child in Spanish.
La Niña (Cold Phase)
La Niña means Little Girl in Spanish.
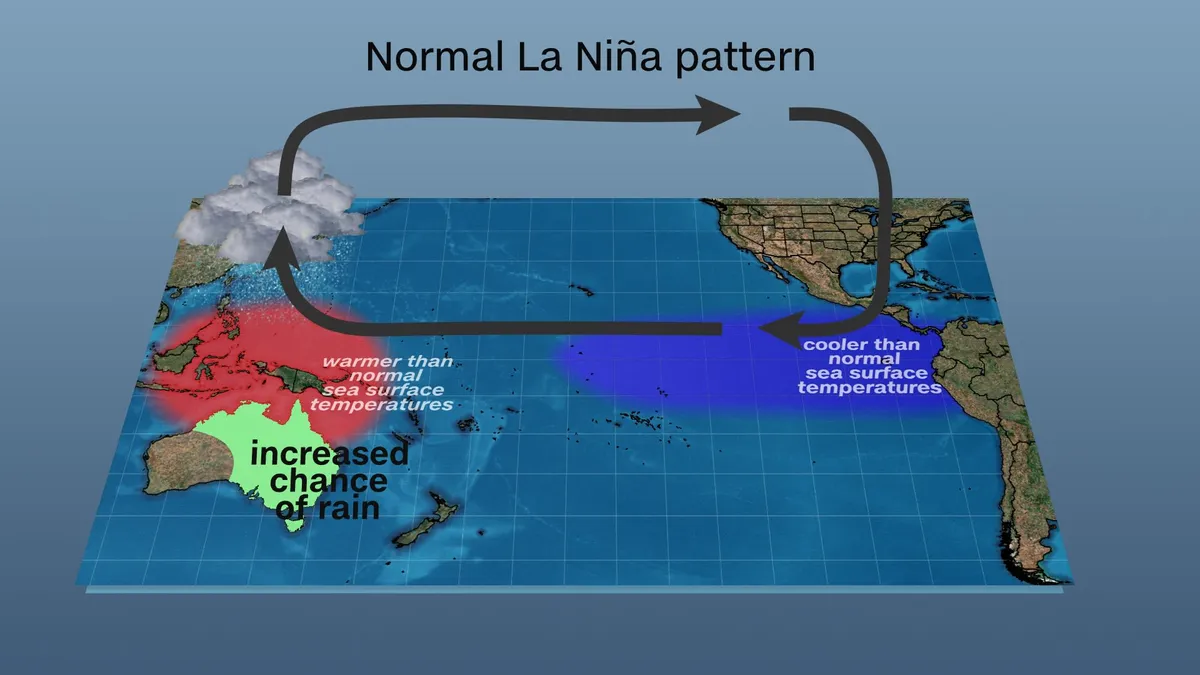
Anomalous strengthening of the Walker cycle causes La Niña, which leads to cooler ocean temperatures in the central and eastern equatorial Pacific due to increased upwelling. La Niña is an oceanic-atmosphere phenomenon known as El Niño's counterpart as part of the larger El Niño Southern Oscillation and climate pattern. During La Niña, sea surface temperatures will be 3-5°C below normal across the tropical eastern central Pacific. In the United States, La Niña conditions occur for at least five months of the year when La Niña occurs, however, each country and island nation has a different threshold for a La Niña event based on its own conditions.
For example, the Japan Meteorological Center has declared that a La Niña event begins when the five-month mean sea surface temperature for the NINO.3 region is more than 0.5 °C (0.90 °F) colder for 6 consecutive months or more than be the average value.
Neutral Phase
Average temperature of the equatorial Pacific Ocean ENSO is described as neutral if the climatological changes in temperature are within 0.5 °C (0.9 °F). The neutral condition indicates the state of transition between cold and hot phases. Ocean temperatures (by definition), tropical precipitation, and wind patterns are near average conditions at this stage. Nearly half of all years are in neutral periods. In the neutral stage, other climate anomalies and patterns, such as the North Atlantic Oscillation (NAO) and the Pacific–North American teleconnection pattern (PNA) , have more influence.
North America
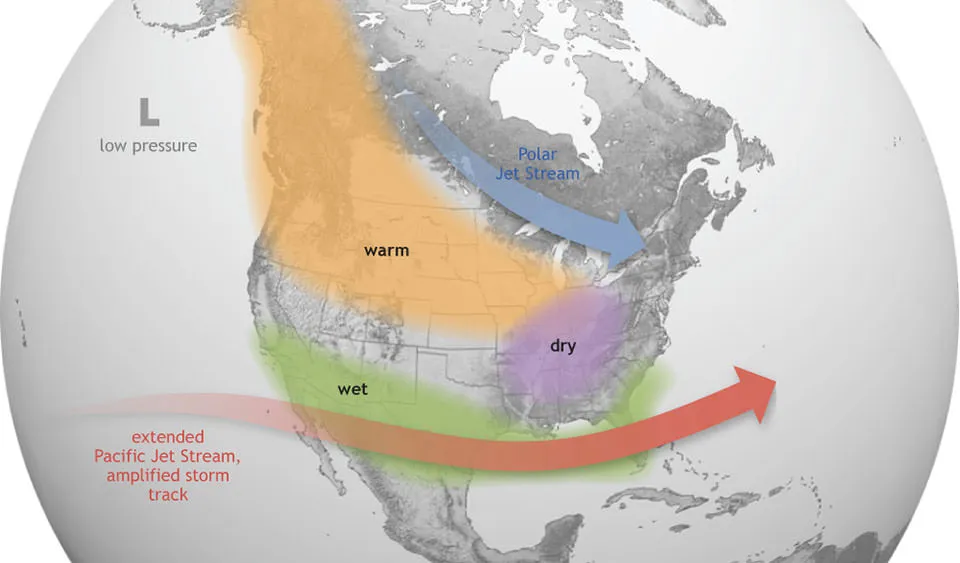
These cold waters in the Pacific push the jet stream northward. This tends to lead to drought in the southern U.S. and heavy rains and flooding in the Pacific Northwest and Canada. During a La Niña year, winter temperatures are warmer than normal in the South and cooler than normal in the North. La Niña can also lead to a more severe hurricane season.
During La Niña, waters off the Pacific coast are colder and contain more nutrients than usual. This environment supports more marine life and attracts more cold-water species, like squid and salmon, to places like the California coast.
Australia
Grab your umbrella, the increased cloudiness and rainfall in the Western Pacific means above-average Spring rainfall in Australia, which can continue into early Summer. This primarily affects the east and north. In January 2021, rainfall across NSW was 41% above the 1961-1990 average*. The chance of widespread flooding increases, especially on the east coast which is usually less affected by La Niña during Winter, but will have wet and flooding Spring and Summers. So ensure you have a plan in place if you live in an area prone to floods.
La Niña’s rainfall and cloud cover reduces average maximum temperatures for those south of the tropics. But north of the tropics, the cloud cover will act like an insulator and bring warmer than average minimum temperatures.
La Niña increases the chance of more tropical cyclones, especially in Queensland. Twice as many make landfall than during El Niño years. This means the strong winds, high seas, and heavy rain increases the likelihood of flooding and major damage.
Middle East
During La Niña, a lot of rains occur in North Australia and Southeast Asia, and on the contrary, around the south of the Middle East and the Arabian Sea (between the Arabian Peninsula and India, in the south of the Oman Sea), the air is subsiding and the high pressures of the subtropical zone are strengthened in this area.
In the La Niña condition , the high pressures in the Western Hemisphere are stronger, especially along the 90° West meridian, due to the existence of cold California, Humboldt currents in the eastern Pacific Ocean. In these conditions, weak intratropical low pressure and high pressure near the tropics are pushed towards the equator and reciprocally in the opposite hemisphere, the high pressures are pulled towards the pole due to the relative strengthening of the recent low pressure, and the occurrence of droughts is relatively more frequent in the Middle East.
North America
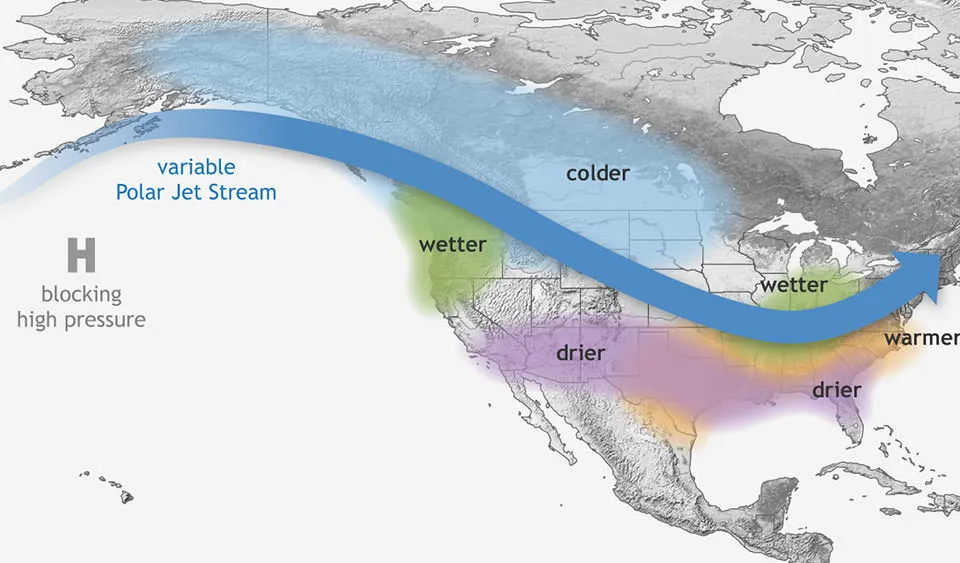
El Niño can affect north America weather significantly. The warmer waters cause the Pacific jet stream to move south of its neutral position. With this shift, areas in the northern U.S. and Canada are dryer and warmer than usual. But in the U.S. Gulf Coast and Southeast, these periods are wetter than usual and have increased flooding.
El Niño also has a strong effect on marine life off the Pacific coast. During normal conditions, upwelling brings water from the depths to the surface; this water is cold and nutrient rich. During El Niño, upwelling weakens or stops altogether. Without the nutrients from the deep, there are fewer phytoplankton off the coast. This affects fish that eat phytoplankton and, in turn, affects everything that eats fish. The warmer waters can also bring tropical species, like yellowtail and albacore tuna, into areas that are normally too cold.
Australia
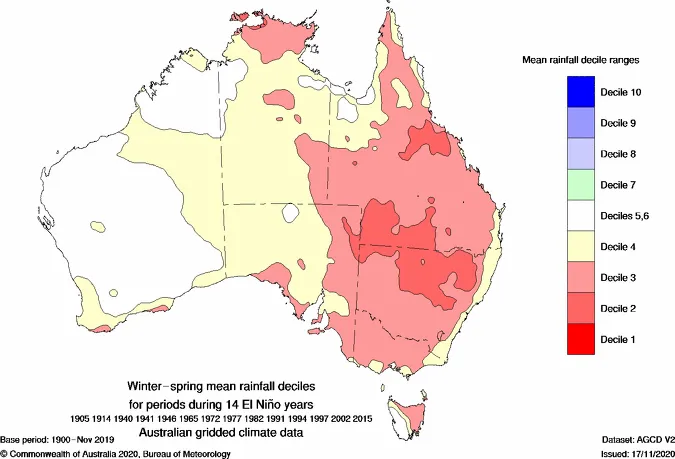
The shift in rainfall away from the western Pacific, associated with El Niño, means that Australian rainfall is usually reduced through winter–spring, particularly across the eastern and northern parts of the continent.
Nine of the ten driest winter–spring periods on record for eastern Australia occurred during El Niño years. In the Murray–Darling Basin, winter–spring rainfall averaged over all El Niño events since 1900 was 28% lower than the long-term average, with the severe droughts of 1982, 1994, 2002, 2006 and 2015 all associated with El Niño.
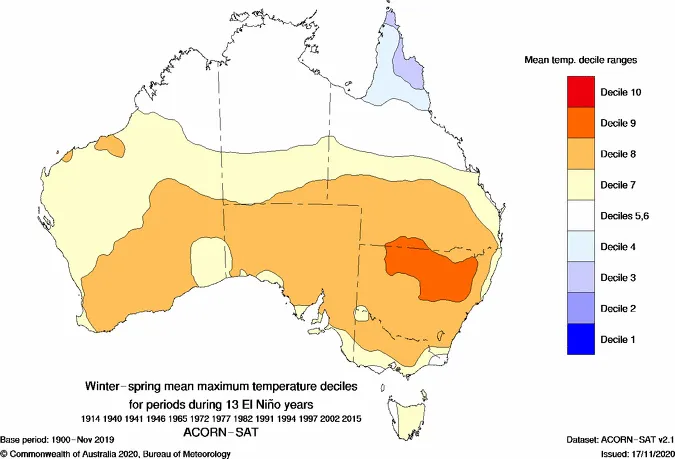
El Niño years tend to see warmer-than-average temperatures across most of southern Australia, particularly during the second half of the year. In general, decreased cloud cover results in warmer-than-average daytime temperatures, particularly in the spring and summer months. Higher temperatures exacerbate the effect of lower rainfall by increasing evaporative demand. Prior to 2013 (a neutral ENSO year), Australia's two warmest years for seasonal daytime temperatures for winter (2009 and 2002), spring (2006 and 2002), and summer (1982–83 and 1997–98) had all occurred during an El Niño. The warmth of recent El Niño events has been amplified by background warming trends which means that El Niño years have been tending to get warmer since the 1950s.
Middle East
During the period of El Niño phenomenon in North Australia and South East Asia, the rainfall decreased drastically and airflow increased in the South Middle East and South West Asia,
Often the low pressure of Sudan and the Red Sea was stronger than the average in El Niño , which causes the transfer of energy and moisture to middle and high latitudes.
Following this mechanism, the high pressure subtropical system in the Eastern Hemisphere recedes towards the equator, and on the other hand, the western wind belt and its waves advance towards the equator, which causes the occurrence of wet periods in the Middle East.
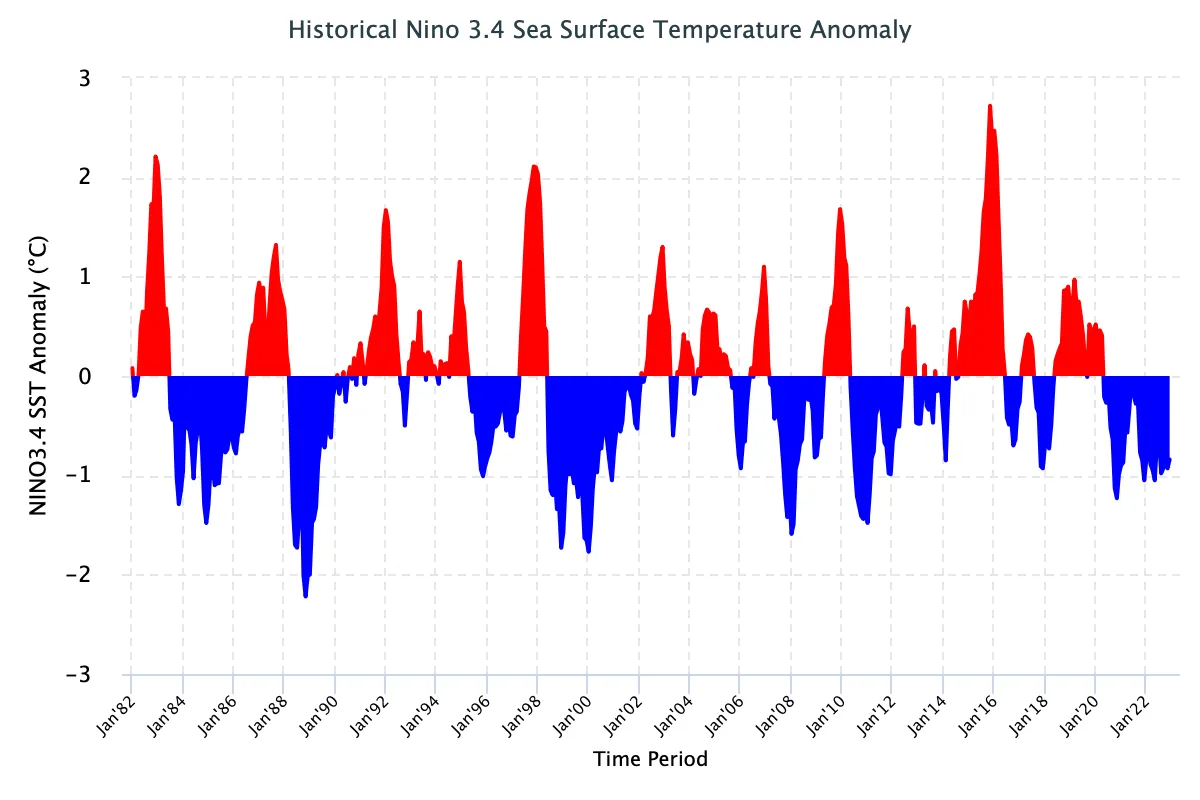
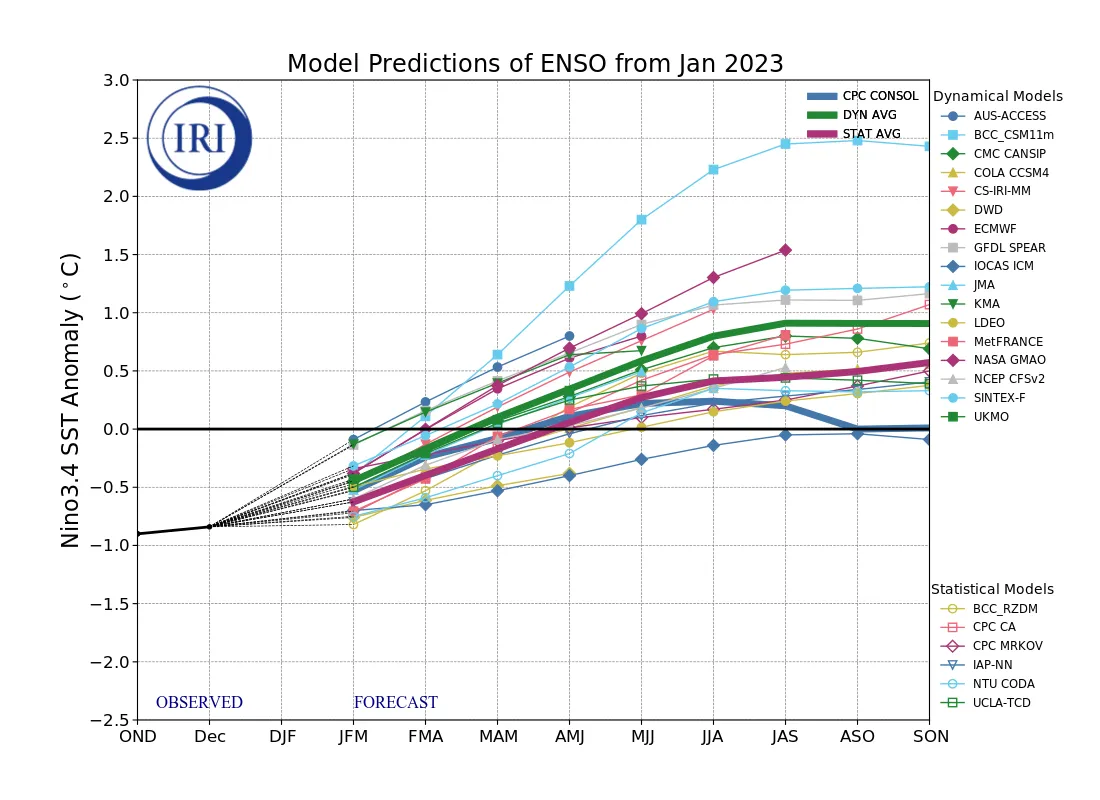
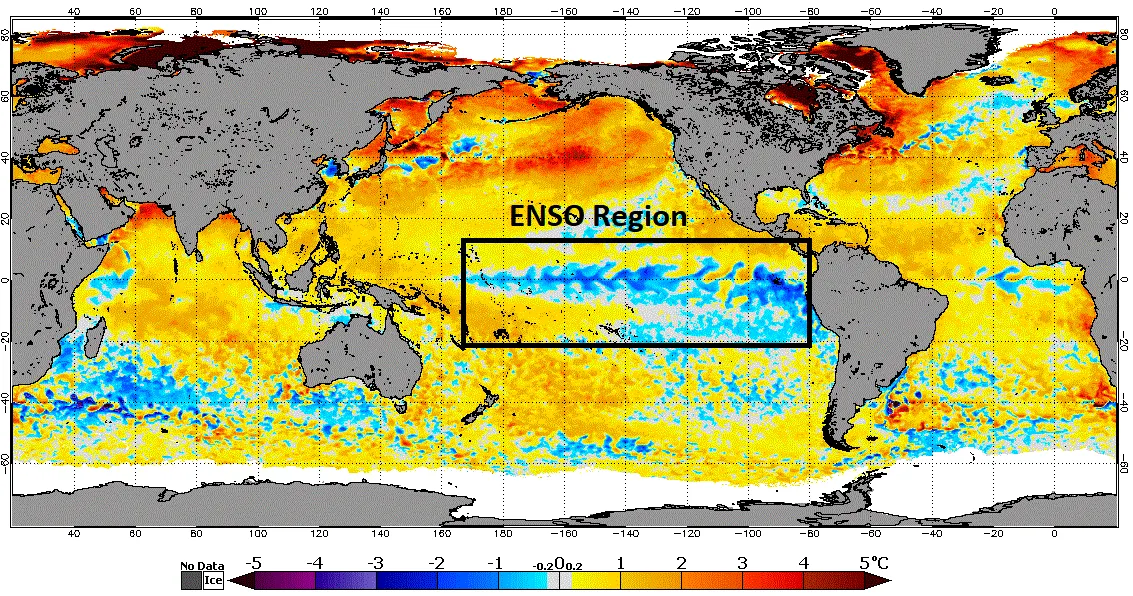
In the figures above, you can see the status of the Enso index in recent years and also the prediction of Columbia University about the future of this index. As you can see, Columbia University believes that La Niña is collapsing and will be replaced by a neutral phase and then El Niño in the coming months.
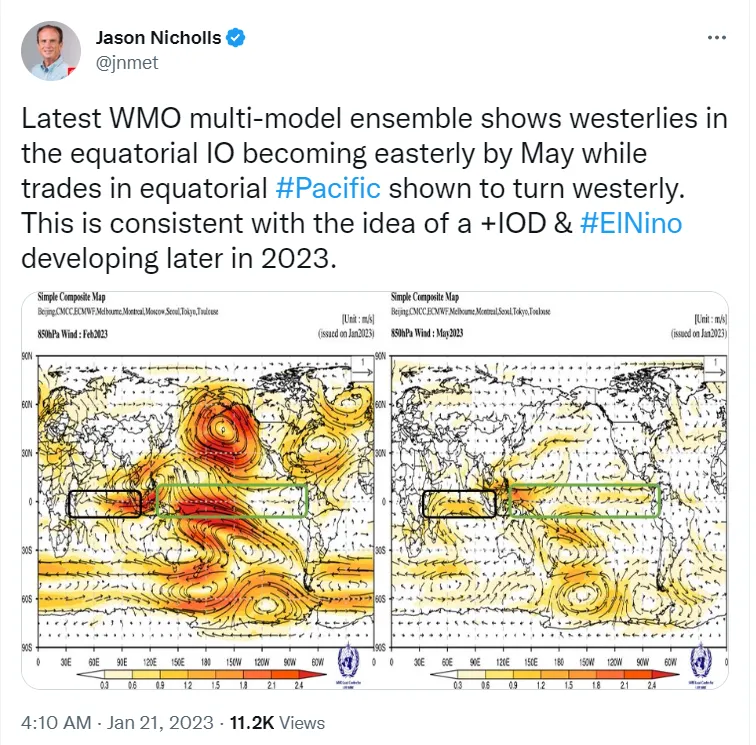
Also, the senior analyst of Accuweather Jason Nicholls confirmed this trend in a tweet and predicted the development of El Niño in 2022.
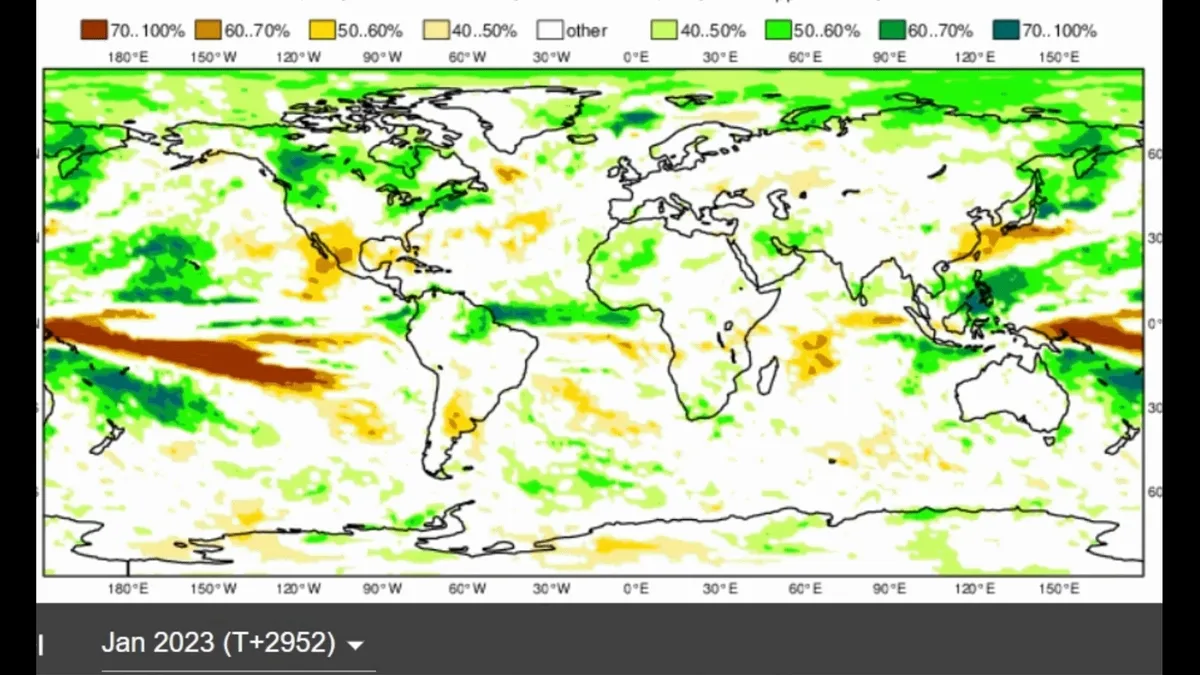
In the pictures below, you can see the forecast of ECMWF precipitation in September 2022 for the coming months (at this time, the Enso index is rising and going towards El Niño). What is clear is that as time goes on, the predicted precipitation in the Middle East is increasing, which indicates the beginning of wet periods. On the other hand, we see Australia, where the predicted rainfall is gradually decreasing, and this can be a good example of the effect of the Enso index on the global climate. In the case of America, there is an irregularity that can be attributed to the influence of other indicators in the climate of the region.
Do you think a child can affect the global climate? When you first encounter this question, you may say, what is this stupid question?
But we ask you to read this dashboard completely to find the answer.😄