Open Analytics Bounty: ETH (November 6)
Open analytics bounties are all about deep dive dashboards into one specific topic.
- According to the chart of transfers during Uniswap, we can see that after the new investment, the transfers have increased, from 61.85 M to 77.25 M.
- The second chart, which shows the volume of transfers and the average size of transfers based on the period, initially decreased and then increased.
- The next chart shows the number of users who move based on the period. In this chart, we can see that since September 17, the number of transfers is decreasing, but after the new investment, the number of users is increasing.
- The first chart shows the distribution of transactions based on volume in both periods. We can see that before the new investment, the range where there were more transactions was between 1 and 10 thousand, and after the new investment, the values are more distributed.
- It is quite clear that the number of transactions has decreased drastically after the new investment.
- In the UNI volume distribution chart based on the size and period after the new investment, the distribution volume has decreased.
- The next two charts show the distribution of transactions by volume over time. We can clearly see that the volume of distribution in the range of $10,000-$10,000 has suddenly increased in November 7, from 478 to 981. Of course, the volume of distribution has increased in all areas in November 7.
- Distribution in transfers in the range above $100,000 has an increasing trend and is more than the rest of the ranges. The transaction volume in this range on Nov 11 is at the highest volume during the period of 142.0044M.
What Is Uniswap (UNI)?
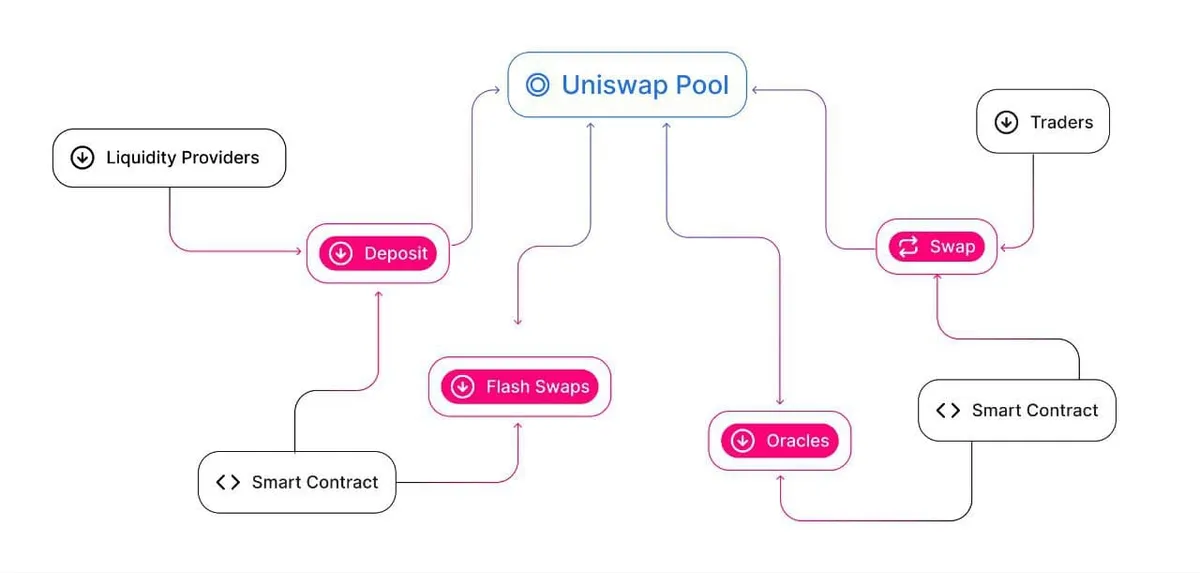
Uniswap is a decentralized exchange that enables peer-to-peer market making. Uniswap is also a cryptocurrency whose symbol is (UNI). The Uniswap platform enables users to trade cryptocurrencies without any involvement with a centralized third party.
The Uniswap blockchain is hosted on the Ethereum platform and governed by UNI holders. Uniswap describes its blockchain as a public good.1 The Uniswap blockchain is open source, meaning that anyone can view and contribute to the blockchain's code.
The Uniswap platform can support the exchange of any digital token that adheres to the Ethereum technical standard known as ERC-20. Uniswap uses smart contracts, which are enabled by blockchain technology, to function as an automated market maker.3 Uniswap users can securely create liquidity pools, provide liquidity, and swap a variety of digital assets.
As a decentralized exchange, Uniswap uses a permissionless design. The Uniswap protocol is available for anyone to use, and the Uniswap platform has no ability to selectively restrict access. Anyone who chooses can use Uniswap to trade digital assets, provide liquidity, or create a new market in which to exchange a new pair of digital assets.3
The automation provided by smart contracts can make trading assets more efficient. Uniswap uses smart contracts to also avoid liquidity issues that traditionally affect centralized exchanges. The elimination of any rent-seeking third party, such as a centralized exchange or financial institution, can also reduce transaction processing fees.

In the two charts that show the distribution of swaps by pool and period and their distribution, two pools (uni_weth 300 and uni_weth lp) are higher than the rest of the pools, but the trend of both is downward and after new investment, both of them They have reduced their values by half.
The last chart shows the evolution of UNI token price. The chart shows the clear effect of the new investment on the token price, which after the new investment was an upward trend, but from Nov 5 onwards, the trend of this chart is downward and on Nov 9 2022 at 20:00, it reached the lowest value of 5.192423 in the period.