CryptoPunks Trades Analysis
Crypto Punk Sales Analysis
The punks need no introduction. Crypto Punks were one of the OG NFT collections and some of the prized NFTs out there. In this dashboard, sales trends for punks are covered such as # of sales, volume, and price. In addition, sales are segmented by the individual punk and traders to see which are the most profitable. Finally, clustering segmentation was implemented to gain insights into the different traits of traders and punks
Volume
Like sales, Punk Volume was highest in late summer with over $660M in volume but had a drop down. Unlike sales, May actually saw lower volume for punk in ETH. However, if you compare by $USD volume, August 2022 is the lowest month since 2021. It is still extremely impressive that Punks have done over 2.05 Billion dollars in volume!
Sales Trends for Punks
This section looks at secondary sales for punks by week/month/daily (depending on filter) as well as new owners of punks. In its history, Punks have seen two surge in sales and new owners Spring 21 and Late summer of 21 during the NFT bull market. In 2022, sales and new members have decreased. In the August we actually saw the lowest amount of punk sales since November 2020. Whats shocking about this is that most people haven’t even of an NFT back then!
Punk Traders
Ever Traded a Punk Before? If you have bought and sold a punk on the secondary market, then your address should appear on here. In this section, we look at some of the top Punk traders by total profit and some of the worst punk traders. There are over 2380+ traders who have bought and then sold the same Punk on the secondary market (only Punks included in this piece) . Measurements are only included in ETH as that’s the best way to play the NFT flipping game. The top punk trader has made over 2600+ ETH trading punks. In fact, the top 35 traders have made over 500+ ETH selling punks. Even the top 1000 traders have made over 23+ ETH in profit. It appears that around 70% of Punk traders are profitable (ETH greater than zero). THe worst Punk trader lost over 250+ ETH when he sold his punk in early 2022. That’s gotta hurt. One other interesting fact is that the top ten most profitable traders make up 13% of the trades in the analysis. This shows to me a high concentration in a few traders to control the markets in my opinon
Top Punk Holders
Looking at the balances of wallets with at least one change (also excluding wrapped Punks from analysis) in the past year, the charts below were derived. The top 20 holders of punks make up close to 25% of the top control of punks. The top three holders of punks have 418,218,215 punks in their wallets. To be a top 20 holder, you have to holder over 50+ punks. That’s alot of punking money. Looking at the balance in the past year to see the min date of a change and the max change, we can see that the top 25 wallets increased their collections by at least six punks. The top 10 increased their punk collections by at least 14+. Once again a lot of punking money.
Analysis by Punk NFT
Over 6270 punks have been traded on the secondary market. Some of these punks may be lost, gifted instead of sold, or some might be doing a really good damn job of HODLing the shit out of them. One punk has had over 165+ trades on the secondary market. However, the top ten most traded punks only make up 3% of trades which may point that there isn’t a ton of trading between the same few punks going on. Another interesting piece is that some punks are unprofitable. This is more likely due to market conditions than the actual punk. Similarly, the more owners a punk has doesn’t necessarily mean more profits as the pie chart in the bottom left show below.
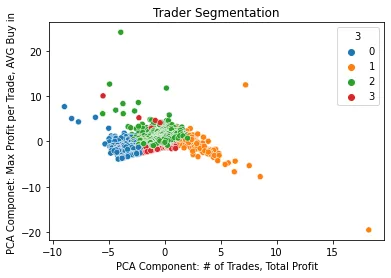
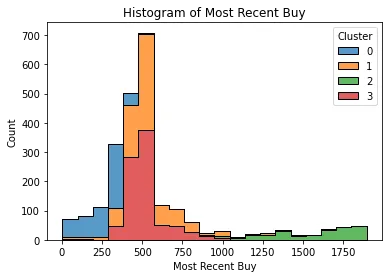
Segmentation of Traders
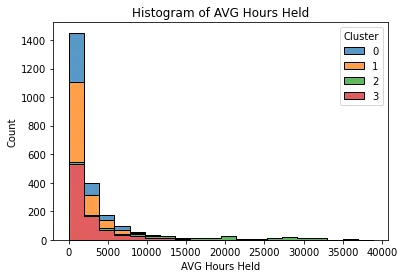
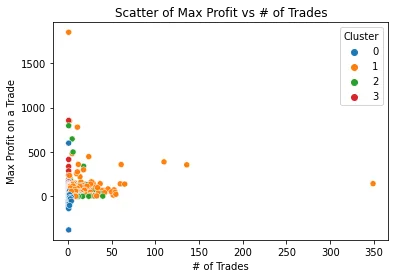
To better understand the qualities of punk traders, a clustering segmentation was performed using python (results are here ) From the analysis, four clusters were derived with the following traits:
Cluster 0: These are traders who came onto the Punk scene in the past year. They are not very good at trading (small profits and most unprofitable traders are included in this section). They haven’t performed that many flips. These addresses are driving a lot of the recent trades
Cluster 1: The grinders. These traders are those that trade a decent bit (10+ punk trades for the most part). They tend not to hold punks for that long. Most have made good money and a lot of the top traders are in this cluster. These are good wallets to look at what they are active in
Cluster 2: These traders haven’t traded a lot but they got into punks relatively early and made a decent profit (some bought punks for .5 ETH and flipped it for 3 digits of ETH). A lot of these traders haven’t been super actively recently (may have switched to other wallets as well)
Cluster 3: The oldest addresses. The yheld punks for the longest and for the most part were some of the first addresses to start trading. These are good wallets to see how they spend their spoils as well
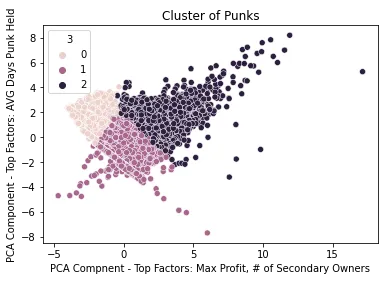
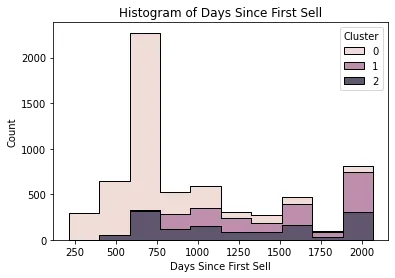
Punk Clustering
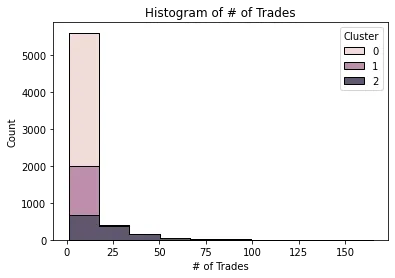
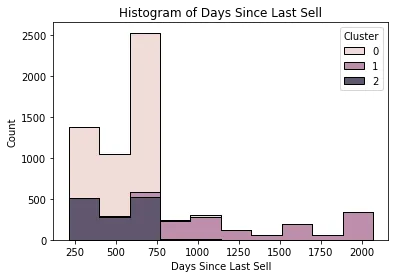
Similar clustering was done by fungible token as above. The following insights are shown:
Cluster 0: Punks that haven’t been traded a lot. In fact many of their first trades didn’t happen until the last year and half. These punks are the ones for the most part that have been traded around lately
Cluster 1: Similiar to Cluster 1, these are the punks that are mostly traded around. Unlike cluster 0 they have been on the market a bit longer and have had more trades per token than other groups. Some of the most heavily traded Punks are in this cluster
Cluster 2: These punks for the most part haven’t been seen in the past 2 years. Whether that be due to them being lost or just plain HODLing is up for further analysis
Conclusion
A lot was covered in this dashboard. For some of the top insights to conclude with: -Punk sales are down. August was the worst month of Punk sales since November 2020. While volume and the average price are down from all time highs, they are not doing as poorly from previous months -Over 70% of Punk flippers are profitable. The worst trader lost over 250 ETH. Most of the unprofitable traders are those that bought in the past year and most likely panic sold as market conditions got worse -The top 1000 punk traders have flipped their way to over 23+ ETH in profit. Not bad. Not bad at all -To be a top 50 punk holder, you need to have over 50+ punks. To be considered in the top 25 biggest increases in punks, an address would need to collect at least 6 punks in the past year. Lots of money -Four unique clusters for traders emerge. Mainly around how often they traded and how long they have been in the game for -Similarity, three cluster of punks were formed around when they first appeared on the secondary market, how often they were traded, and other traits.
If you made it this far props off to you.