Citizens of NEAR
Methodology
Assuming that NEAR is a city in order to get a clear insight to the its citizens we first need to get hold of some basic information.
-
What is the population?
To find this we need to find how many Actions with type “CreateAccount” occurred.
-
What is the city’s growth rate per month in terms of new citizens?
-
Did anyone decide to leave the city? If so How many and what’s the rate?
This is the counter part of the create account action namely “DeleteAccount”.
-
How many city constructors, namely developers, are there?
This is found by looking at actions with type “DeployContract”
-
And finally as in the case of active users in the city, we can group the citizens into classes. For the brevity of the analysis we will simply form the following classes?
-
The “Very Active Users”: These users or “contracts” have initiated transactions more than the average number of transactions over the past 30 days.
-
Active Users who have transacted more than the median of the number of transactions per user over the past month and less than the average.
Note that this class along with the Very Active Users class are considered as “active users” of the NEAR
-
“Semi-Active Users” who have transacted less than the median of transactions per user in the past month.
-
The Criteria For Being an Active User
The {{Population}} parameter above changes the data that determines the activity of the active users. It can be observed that there are addresses that have hundreds of thousands or even million transactions in a month. This type of addresses create a very large standard deviation which is an indication of how distant are data points from the mean/average.
For this purpose the past month’s average is used to determine the addresses that are very active with number of transactions more than the average in a month. Users with transaction numbers between median and average are taken to be the “regular active users” who do not have transaction in the magnitude of a dApp or the Aurora EVM.
At this time Suggested values for the parameter are as follows:
- 200,000 ( Full Spectrum of Addresses)
- 115,000 ( Filter out large dApp with very high transaction volume)
- 110,000 ( Filter out whale magnitude transaction activities)
- 105,000 ( Regular Users Transactions volume)
- Anything below 100,00 renders mostly users with the same transaction volume, and is resource heavy to calculate
NEAR’s Active Users Visualization
These users are visualized by finding their total number of transactions over the past month, finding the address of the user with the maximum amount of transaction on that day and total transaction fees incurred on that day.
Welcome To NEAR City
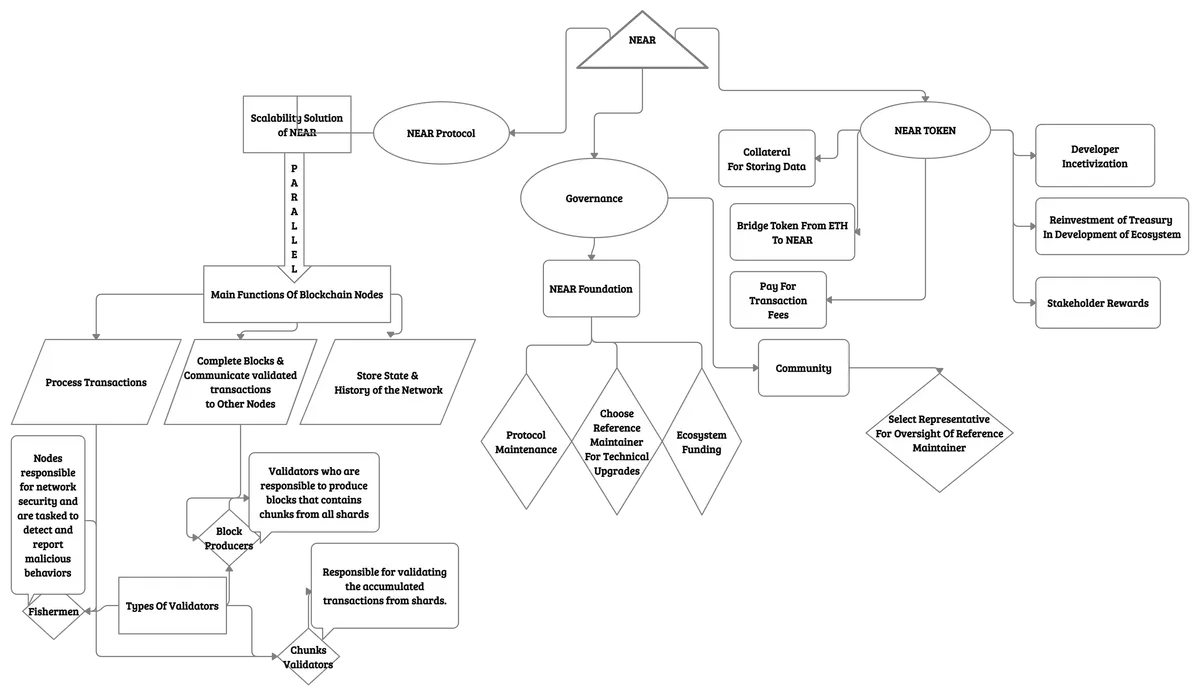
NEAR is a very extensive ecosystem of Blockchain Bridges(Rainbow Bridge), App specific blockchains(Octopus Network), dApp development environment(Aurora), DEXs, NFTs and so much more. Since it will not be possible to cover all of this ecosystem in an introduction and inside a dashboard, a prepaid block diagram of the inner working of the network on a basic level was created using Creately. The diagram gives an overview of the overall operation of the system and explains what problems it has aimed to solve.
City Map
> 1st Map
Diagrams below are like the NEAR city’s mini map. In this map the NEAR protocol is explained and shows how it solves the scalability solutions by implementing “Sharding”. An overview of Governance is given with related parties responsibilities. A minimalistic rundown of usages of the NEAR Token is also shown.
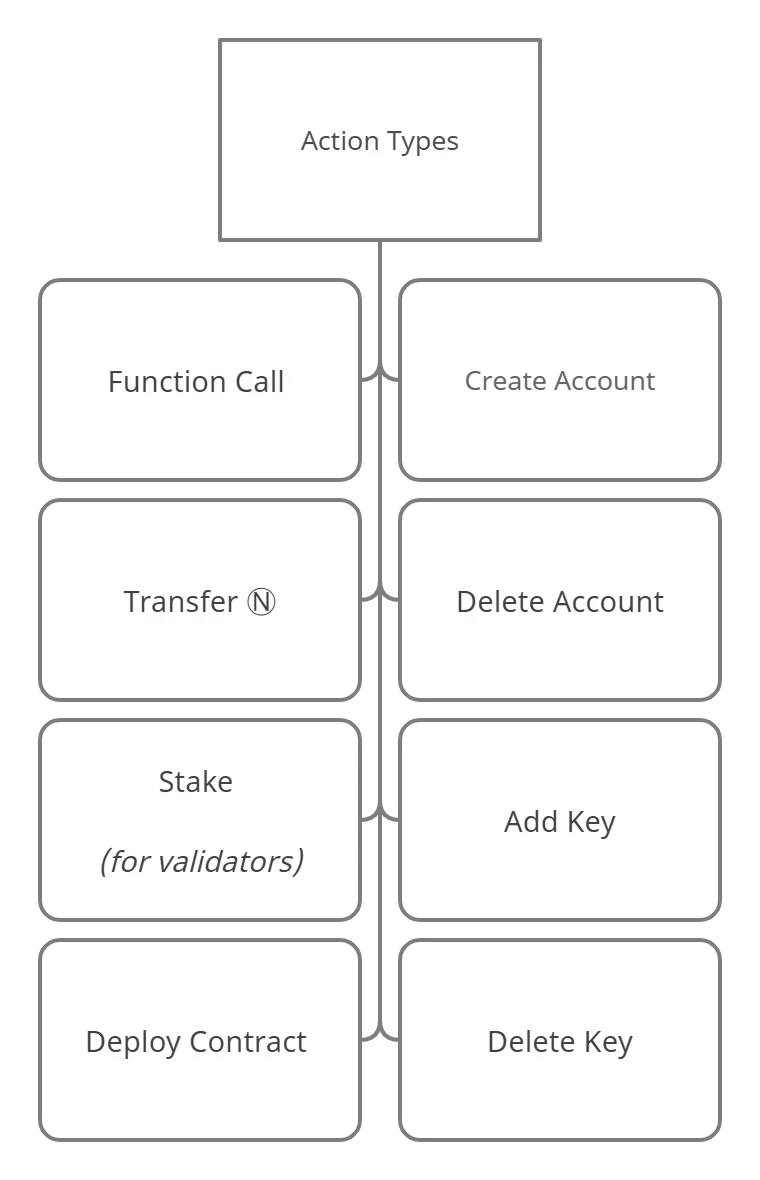
> 2nd Map
What are the different action types in the NEAR blockchain and what functionalities each correspond to.
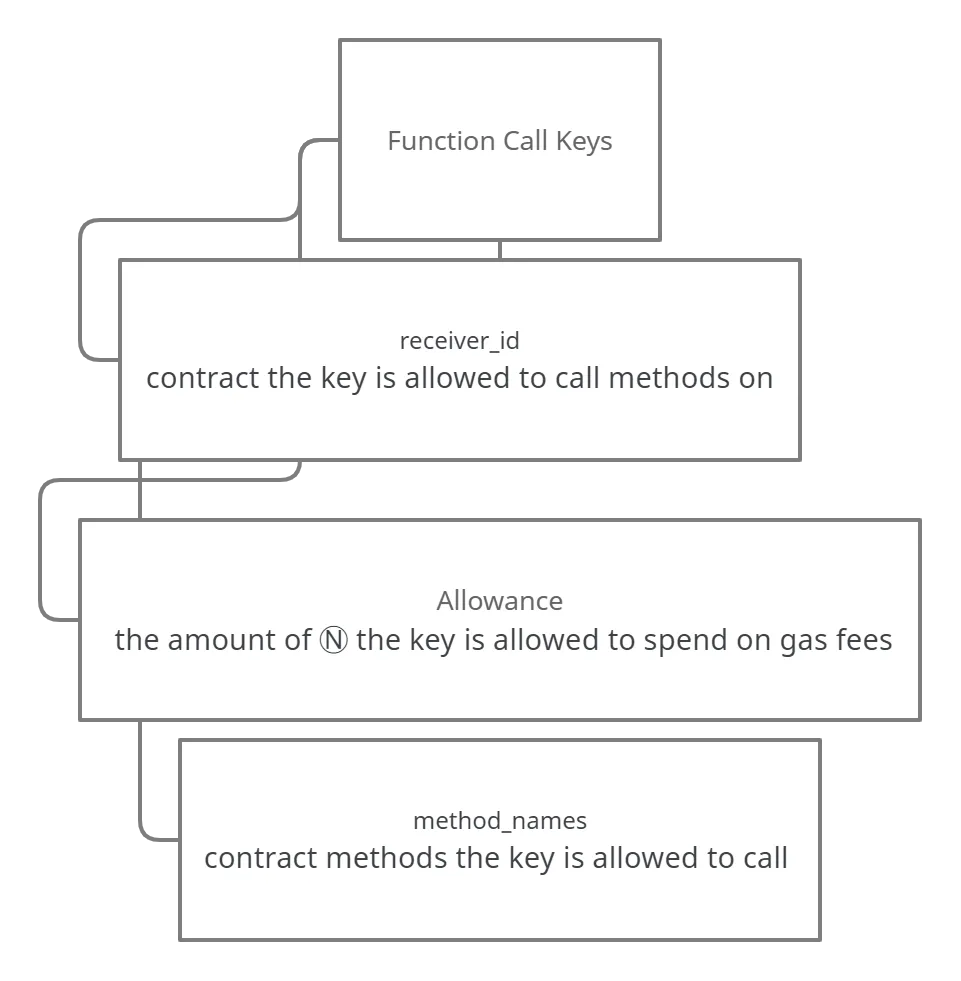
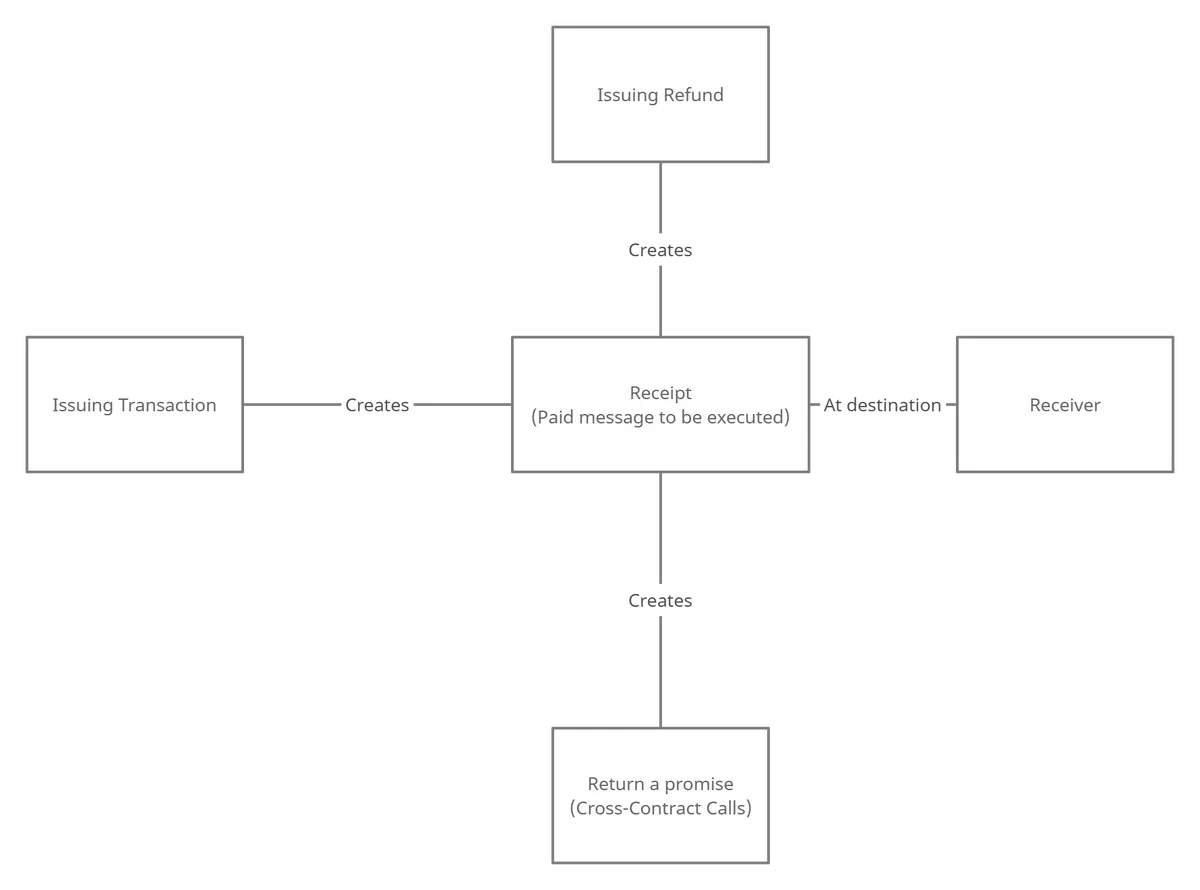
> 3rd 4th 5th Maps
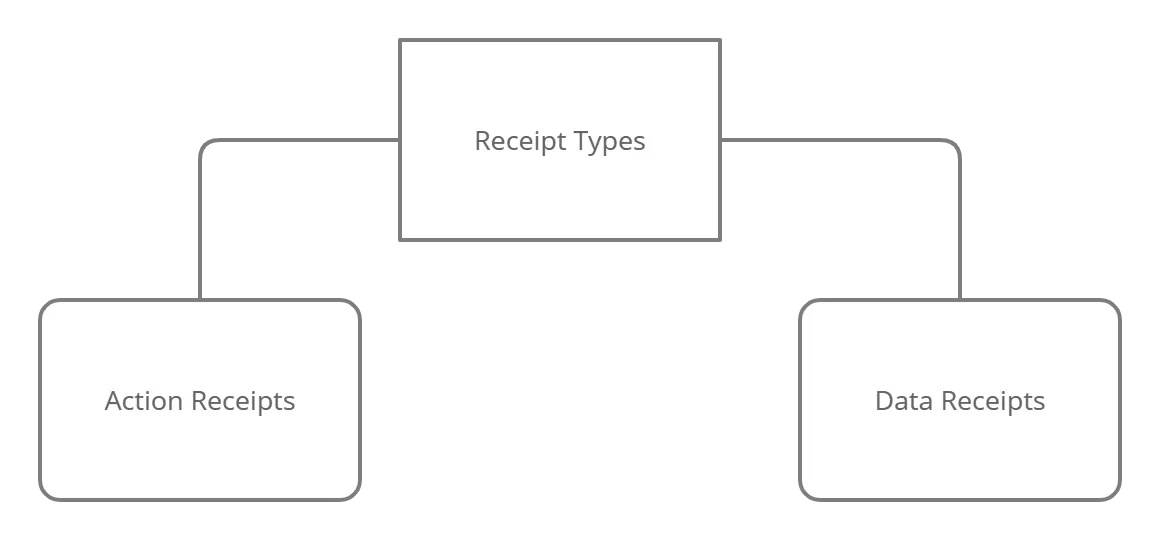
An explanation of some unfamiliar terms specific to NEAR ecosystem is broken down, such as Allowance and receipts. Specially, Receipts that are an active part of the blockchain and have different types and there are many ways that they are created.
NEAR Overall Users Type and Behavior
The chart on the left will be the stepping stone to our analysis of active users. We get to find out the people who have deleted their account and developers who have deployed a contract and most importantly see that more accounts have been created than deleted. Note that these statistics are not disjoint and may have addresses in common. Thus we can not clearly see any pattern on user aggregation or otherwise.
Are There any Trends?
During the last half of 2021, users have mostly been deleting their account and very few compared to that did create an account. But the trend changed after the start of the 2022, it also collided with the existing down trend of user desertions. This month seems to be the turning point for NEAR as from then on have mostly gained new users.
Criteria For Active Users
As explained above active users are determined by comparing their transaction volumes in the past month to the average and median values of the overall amount over the last 30 days.
The change in population parameter, cuts from the top portion of the users who have the highest amounts of transactions. Thus changing the parameter to lower values impacts the default average and standard deviation considerably.
Active Users Activity
Once we determine the active users we can look into their impact as a whole and to the ecosystems transactions in the last 90 days.
For this purpose, for each day we can find:
-
the user who has had the maximum number of transactions and its amount.
-
Total number of transactions initiated by active users.
-
Total amount of transaction fees incurred by the active users
-
And what percentage of the total transactions is initiated by the top address.
The number of transactions by active users take a dip after the May 10th, this is around the date of the crypto crash period on May.
Two interesting periods is noticed by aligning the daily Tx fees chart and total number of transactions chart.
-
From May 4-6th, although there is the same amount of transactions as the day before but the fees have considerably dropped.
To find a possible reason for this we can look at which address has had the maximum number of transactions on this period and what was their percentage share.
Following this logic we find two things:
- During this period sweat_welcome.near address had the most number of transactions on that period that accounted for approximately 50% of the total #txs.
- Comparing this with the days before and after where the percentage share is around the same amount and belongs to aurora.near, we can conclude that the transactions for aurora.near are much more expensive.
-
After June 10th, The transaction fees for aurora.near address considerably dropped disproportionally to the # of Txs. Thus there may have been an upgrade of some sort to reduce the fees.
Conclusion
NEAR blockchain is a powerful, well-funded and well-developed ecosystem that has the potential to become a serious competitor to ETH 2.0. And it has the better scalability and infrastructure to achieve this. The terms involved in the lingo of this blockchain is somewhat unfamiliar and different compared to other blockchains. Thus it may come off a bit strange at first, but once past the initial stage of its learning curve its true potential is revealed.
We have analyzed the ways to define an active user on this chain and have tried to make it so that our definition is not random. A metric exists on this link in NEAR’s DBT github page. The metric defines an active users as one who has initiated more than 2 transactions over the past month. There is no logic behind this number other than maybe its the median of the data as it was calculated in this dashboard.
Thus in order to better analyze this question a further step would be to separate different types of wallets and later perform the analysis on each.