Daily Transactions and Unique Addresses - Polygon
Q1. Count and plot the number of daily transactions and unique addresses on Polygon, beginning July 1, 2022.
With the above question, we’re gonna first take a look at July daily transaction and unique addresses, and then we will dive in transactions and unique addresses from the beginning of 2022. (Although the database only supports from May 2022 until now so we can only show that much of the history, but the query date was set from 2022-01-01.) \n
There is a note about these charts. I run the queries on half of July 9th and that’s why the transaction count and address count were dropped, the day data wasn’t still completed.
If we wanted to decide based on these data and analysis that whether Polygon is still growing or not, I’m afraid that I think we can’t as the database is not complete. So instead of that, I researched other sources to be able to answer that question. And I ran into this website :
These guys analyze Polygon weekly data and write insights about weekly active users, daily transactions, weekly transactions per address, dapp insights etc.
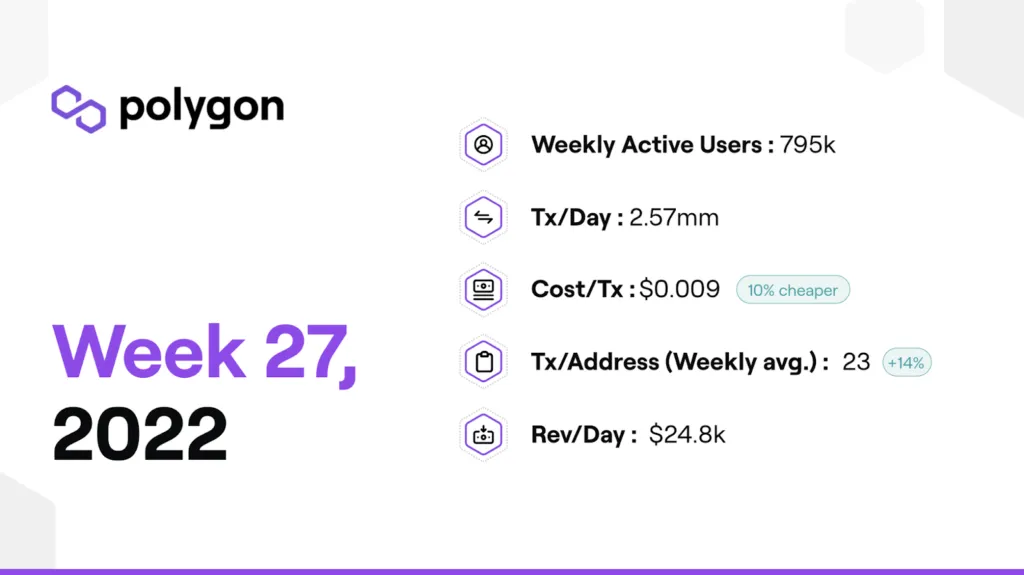
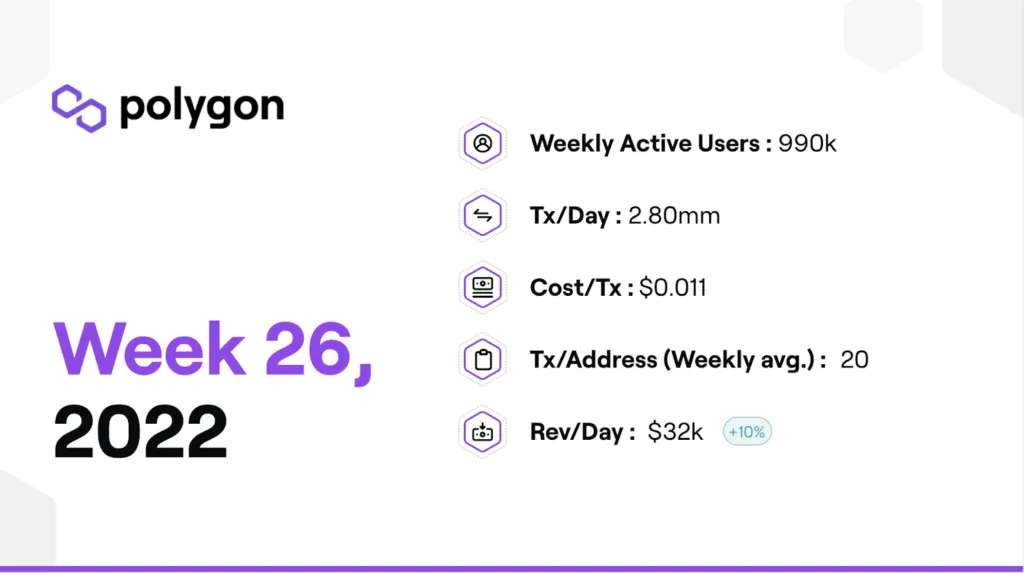
Here we can see that there was a drop from the first week of July in active users, tx/daily.
But overall if we wanna look from a distance and consider long term, like from the beginning of 2022, we see a different outcome.
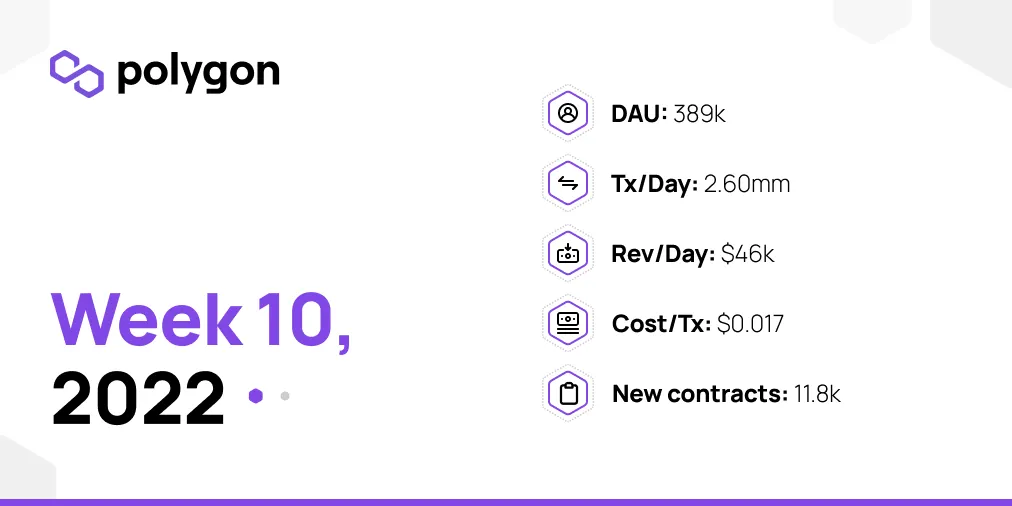
This one belongs to March 2022. If we want to compare it with now, we can see a noticeable user growth ever since.
Overall as I went through the analysis and data on this website, I found out that on whole, as dapps are added, nfts coming down the way and much more, Polygon is still growing.