Polygon Block Performance
What is the average time between blocks on Polygon? What was the maximum and minimum recorded time between two blocks? How many transactions are done in a block on average? How do these numbers compare to L1 such as Flow or Solana, or other L2 such as Arbitrum or Optimism?
Methodology
In this dashboard, I have done the comparison of three metrics among Polygon and two L1 blockchains: Solana and Flow, and two L2 blockchains: Optimism and Arbitrum:
- Average, minimum and Maximum block time difference.
- Average of all transactions in blocks
- Average block time difference per day
Polygon Analysis: Sidechain
- The Polygon is considered to be a sidechain, the difference is that Layer 2 solutions are fully secured by the Ethereum platform, while side chains use their own consensus algorithms.
Note: Due to the incompleteness of database in Polygon, we can’t be totally sure of the results that we see here, so I’ve done a bit of research to gain the correct knowledge.
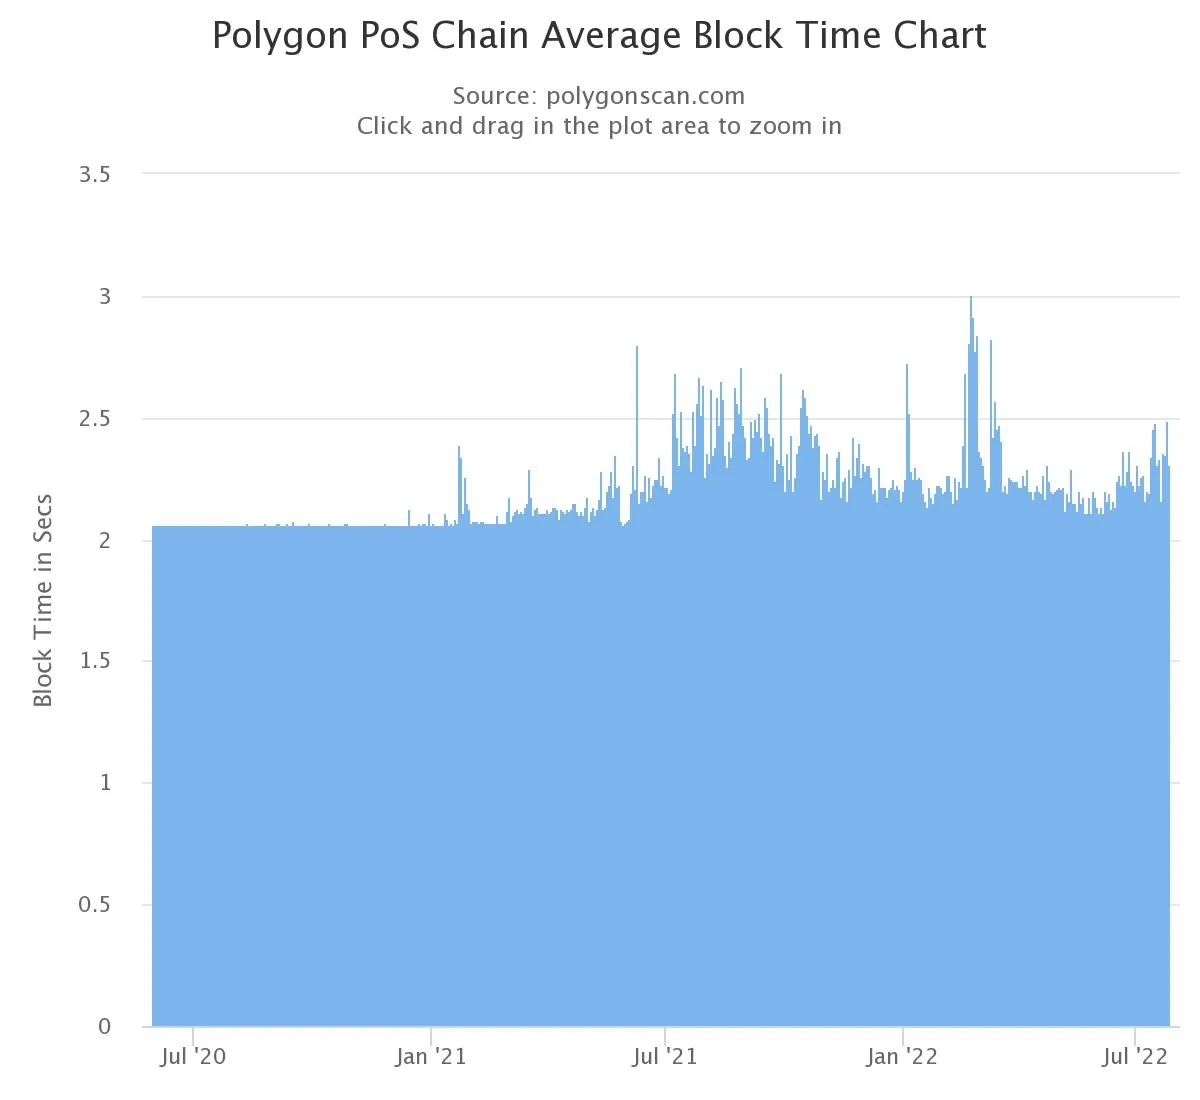
- The below chart comes from Polygonscan.com and it shows the max of average block time was around 3 secs in March.
So the results that we have here are not that far away from how the Polygon network’s been performing in general.
-
The average block time were kind of consistent over the years.
-
When it comes to Polygon, it is based on the Proof of Stake (PoS) consensus mechanism, which has multiple benefits over PoW — such as faster transactions and lower gas fees.
L1s: Solana analysis, L1 comparison
Note: Same here goes as FLOW for minimum time difference between blocks. (due to that database only supports seconds and not microseconds or milliseconds)
-
The maximum block time difference of 16033 secs is for the time of Solana network outage.
-
In Solana network, the time between blocks in in each day is almost equal to the average, and Flow network is almost the same.
-
The number of transactions in each block is significantly different and there are reasons such as network implementations differences, the algorithms of creating blocks which in Solana we have Proof of History and in Flow it is Specialized Proofs of Confidential Knowledge (SPoCKs).
-
Also, if we’re talking market caps, Flow has about $2,000,000,000 but Solana market cap is more than $85,000,000,000.
-
So as the network difficulty in creating blocks gets different, the average block time and average transactions in each block will be different too, and here Solana average block time is lower than Flow.
L2s: Optimism analysis
Note: Same here goes as FLOW and Solana for minimum time difference between blocks. (due to that database only supports seconds and not microseconds or milliseconds)
The interesting thing in Optimism for me was that each block only contains one transaction.
The average block time is also great.
L2s: Arbitrum analysis, L2 comparison
Same here goes as FLOW and Solana for minimum time difference between blocks. (due to that database only supports seconds and not microseconds or milliseconds)
-
Although both Arbitrum and Optimism use the same technology of Optimistic Rollups, the platforms have some fundamental differences in the way they function, particularly in respect to bridging and fraud proof verification.
-
Optimism has the smallest average time among L2s.
-
Here we can see something interesting. The very high average block time difference that we can see from June 15th to June 20th was because of very high congestion on the network that was caused by Arbitrum Odyssey. The campaign got paused a little later on to fix the issues regarding network performance and gas fees.
-
There will be a major update on Arbitrum network and that would change the statistics for sure.
Conclusion
-
Polygon has done a great job in time variance and has been consistent over the years.
-
Optimism has the smallest average block time among L2s.
-
Solana has the smallest average block time among L1s
-
Overall Solana has the smallest average block time and the highest amount of transactions in each block and is the fastest one.
\